How an insurance company reduced IT alerts from 6M to 50K

This is the story of an insurance company that was getting 6 million IT alerts every 90 days and how they used BigPanda AIOps to reduce it to less than 50,000.
Before we get into that, let’s take a step back. How did we, as an IT sector, get to a place where organizations receive 6,000,000 IT alerts in the first place?
I recently discussed this during our webinar: Reduce mean-time to act by tracing alerts through their lifecycle.
The way people look at IT alerts is evolving
In the past, creating events and alerts was incredibly difficult, which naturally limited the number an organization received; whereas now, they can be easily mass-produced.
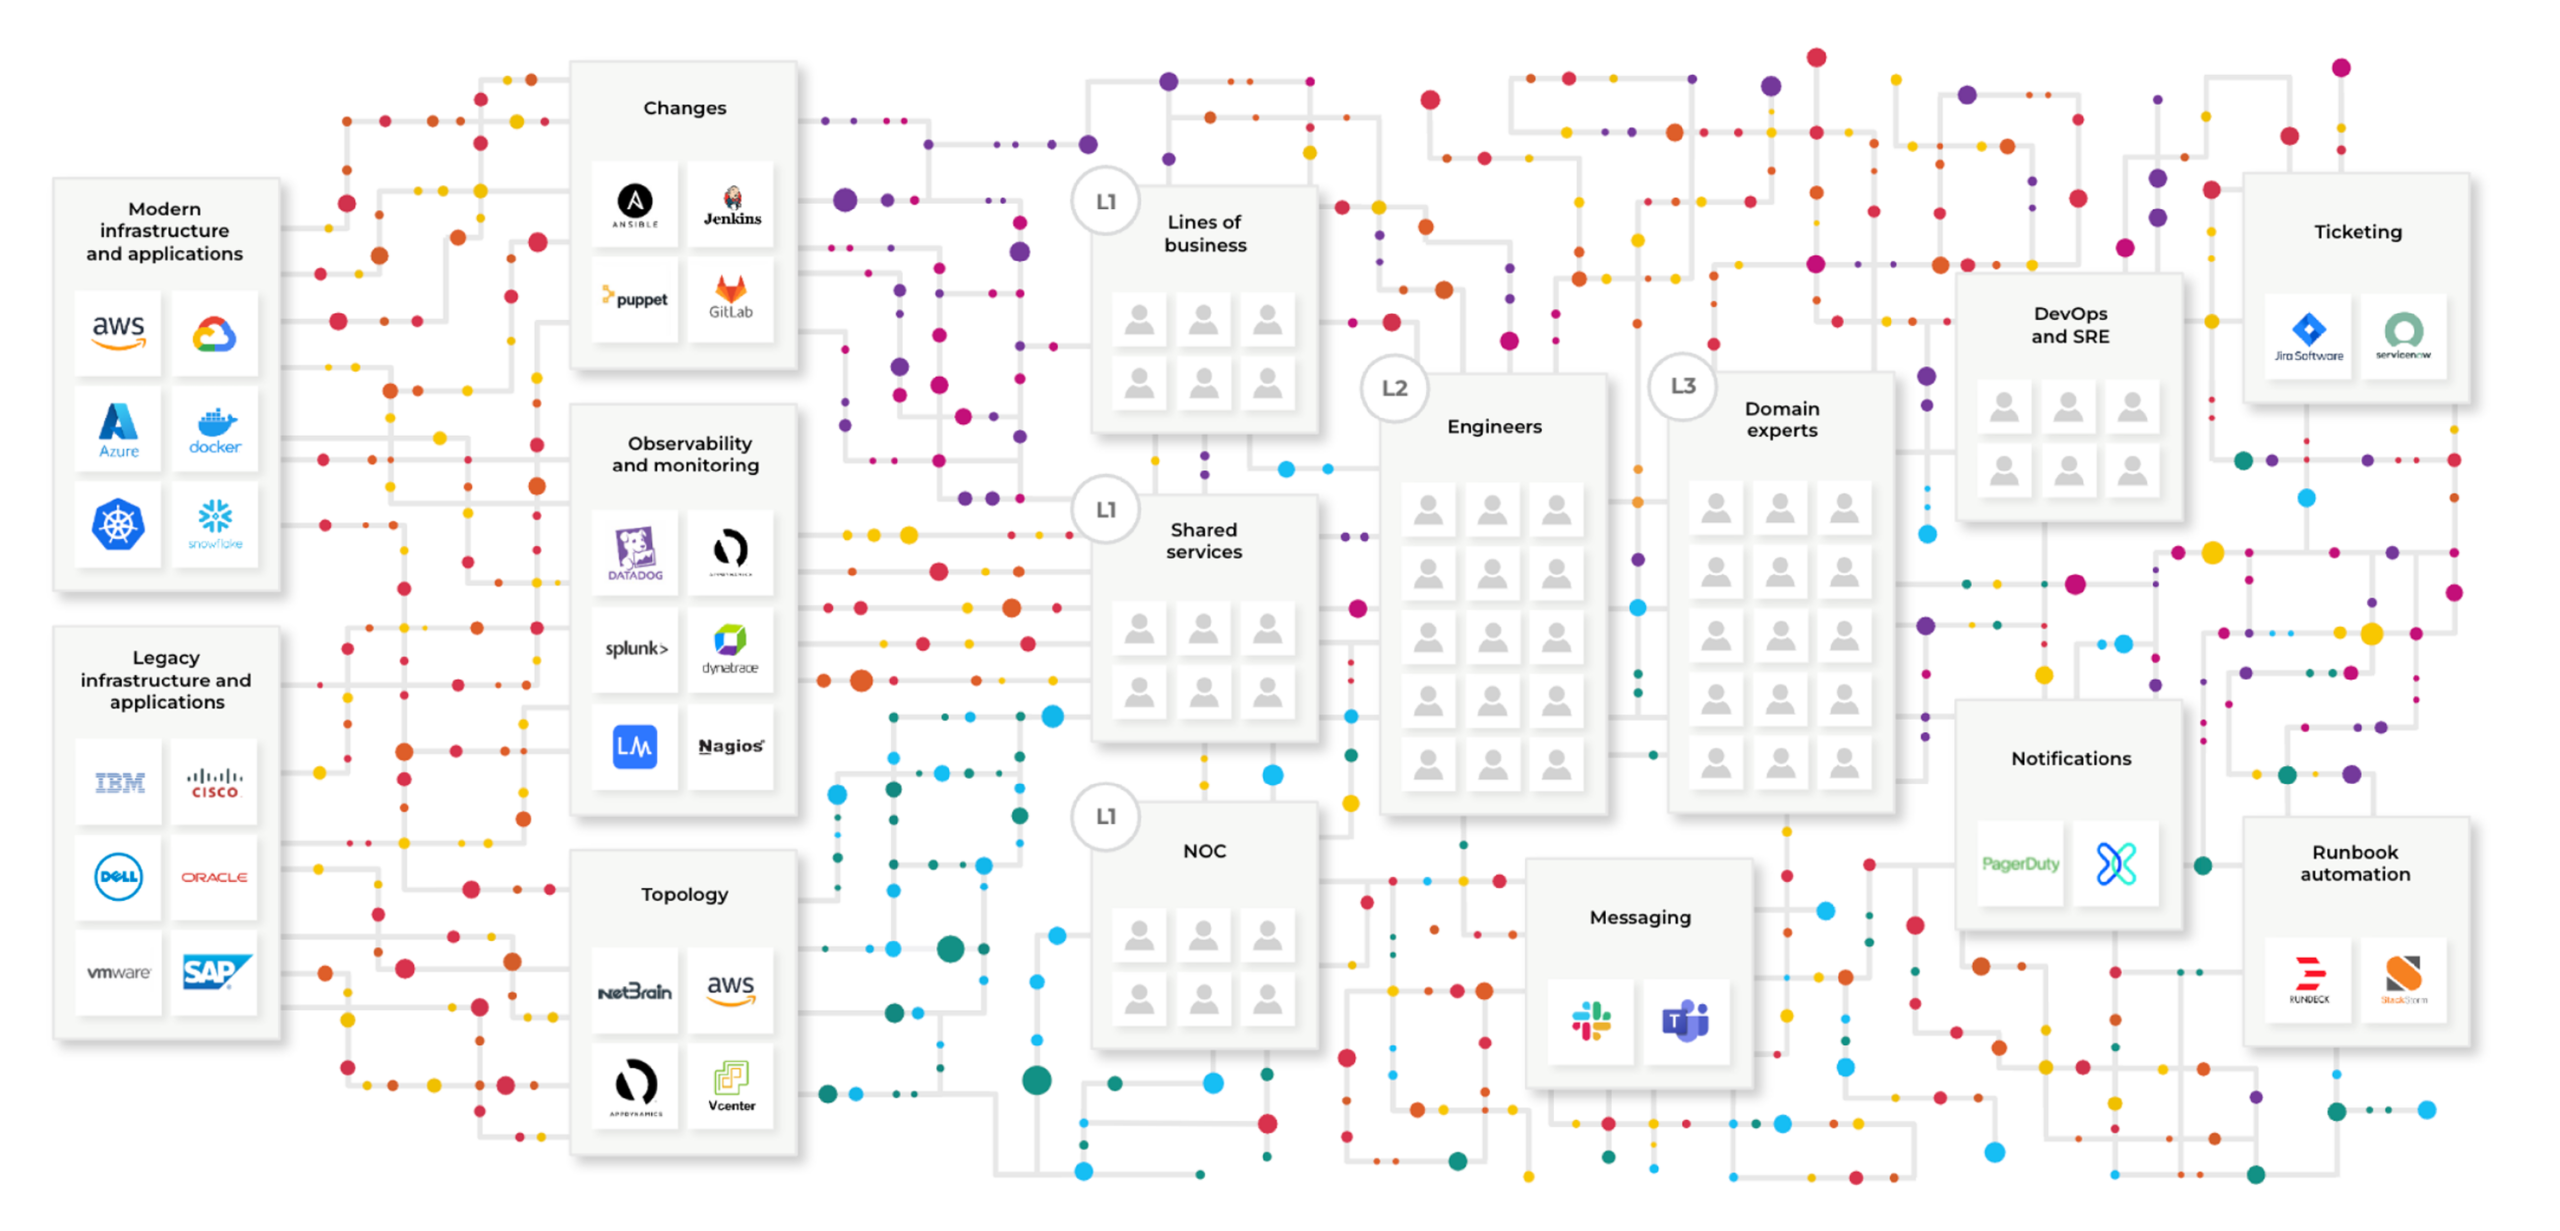
Fifteen years ago, there were legacy infrastructure and apps supported by monolithic vendors. But, even then, they were complex and difficult to manage. Today, many organizations still have the legacy stack, but they’ve added modern infrastructure and applications alongside it. They’ve also added a number of observability and monitoring technologies, which, while definitely valuable, also generate more and more telemetry data—or sometimes, just more noise.
Additionally, because of innovations such as continuous integration and continuous delivery/deployment (CI/CD), the pace of change has accelerated dramatically. There’s no longer a single source of truth, resulting in thousands of changes being tracked across several siloed tools: change audit, change management, and other technologies.
That rapid pace of change also means there is no single source for topology either, which is constantly morphing as topology data is now fragmented across numerous tools.
All of this results in a flood of extra alerts, data, and noise—requiring a lot more human beings to manage it. But those human teams are now split into silos. In many organizations, this means they’re split across the network operations center (NOC), different lines of business, or shared-services teams. And these teams rely on different siloed tools, further fragmenting operations and workflows while making collaboration more difficult.
Your teams are overwhelmed not because of a lack of data or monitoring—but rather, too much.
What does this mean for your teams and your organization?
- Despite investing in world-class monitoring tools, you’re still experiencing outages, latency, and performance problems.
- There are still no easy answers to “What changed?” and “What’s impacted?”
- High-value subject matter experts are being pulled into fire-fighting and bridge calls from hell.
The insurance company we were working with got to a point where they realized that adding even more observability and monitoring wasn’t going to be the solution.
So the question was, how do we solve this? How do we solve these problems while also acknowledging that we’ve made a significant investment in very good monitoring tools, and we still want to make sure we’re getting full value out of these tools?
Measuring success with MTTx can create an unrealistic picture
To start, organizations have to mentally shift how they measure the effectiveness of their IT operations. In the past, when every alert was important, the best way to measure effectiveness was speed. But when many alerts are now just noise, that standard no longer applies.
So, we have to eliminate the idea that mean time to x (MTTx) is the most important metric. In fact, as organizations improve operational efficiency in ITOps, MTTx might actually increase because all the easy problems are getting fixed either instantly or automatically—or they’re never even getting into the pipeline—thus impacting the mean.
The good news is you’re left with fewer problems to solve. However, if you’re only measuring response times, that may not feel like good news because the problems you do have to solve are more difficult and time-consuming.
Let’s be honest though, speed has always been a really easy metric to game. I remember watching some of my operations engineers bulk close 1,000 incidents right after the alerts that started them had fired because they knew they were noise. I also saw an organization that measured mean time to detect (MTTD) as the time of the first comment on the incident ticket. So operators just trained themselves to go in and type in a pointless comment on every ticket that came in to fabricate a low MTTD.
Organizations often unknowingly create strange incentives at the operator level when they only focus on those types of metrics.
The whole situation is long overdue for a rethinking by the industry. And once organizations make that shift, they start making different decisions about how they configure the overall operations pipeline, which can result in some incredible new efficiencies.
How AIOps analytics views ITOps
To start, organizations need to focus on data-to-action analysis. By using visibility, you can trace data flowing through your tools, processes, and teams. Then, looking at actionability, you can focus on taking effective action versus just moving alerts to tickets quickly. Then we get to optimization, where you can focus on alert intelligence to improve the efficiency and effectiveness of the entire system.
Many organizations will tell us, “Yeah, there’s noise, and there’s nothing we can do about it.” But you have to run your system in a way that continuously eliminates noise by identifying it and then getting rid of it.
That means zooming out from the individual incidents and alerts and saying, “These are data flows coming into my system, getting handled by my human and automated processes, and then going out of my system in the form of incidents resolved.”
And that itself is another data set we want to use: what happened with all those incidents? Old school IT says, “Hey, treat all alerts as real until proven otherwise.” But it takes a long time to sort through six million alerts to prove a negative. To look at each one and determine if it can be ignored.

On the left is machine-generated and application-generated data coming into a system and going through some human process, in most cases to hit engineers who have their own tribal knowledge and their own tribal data.

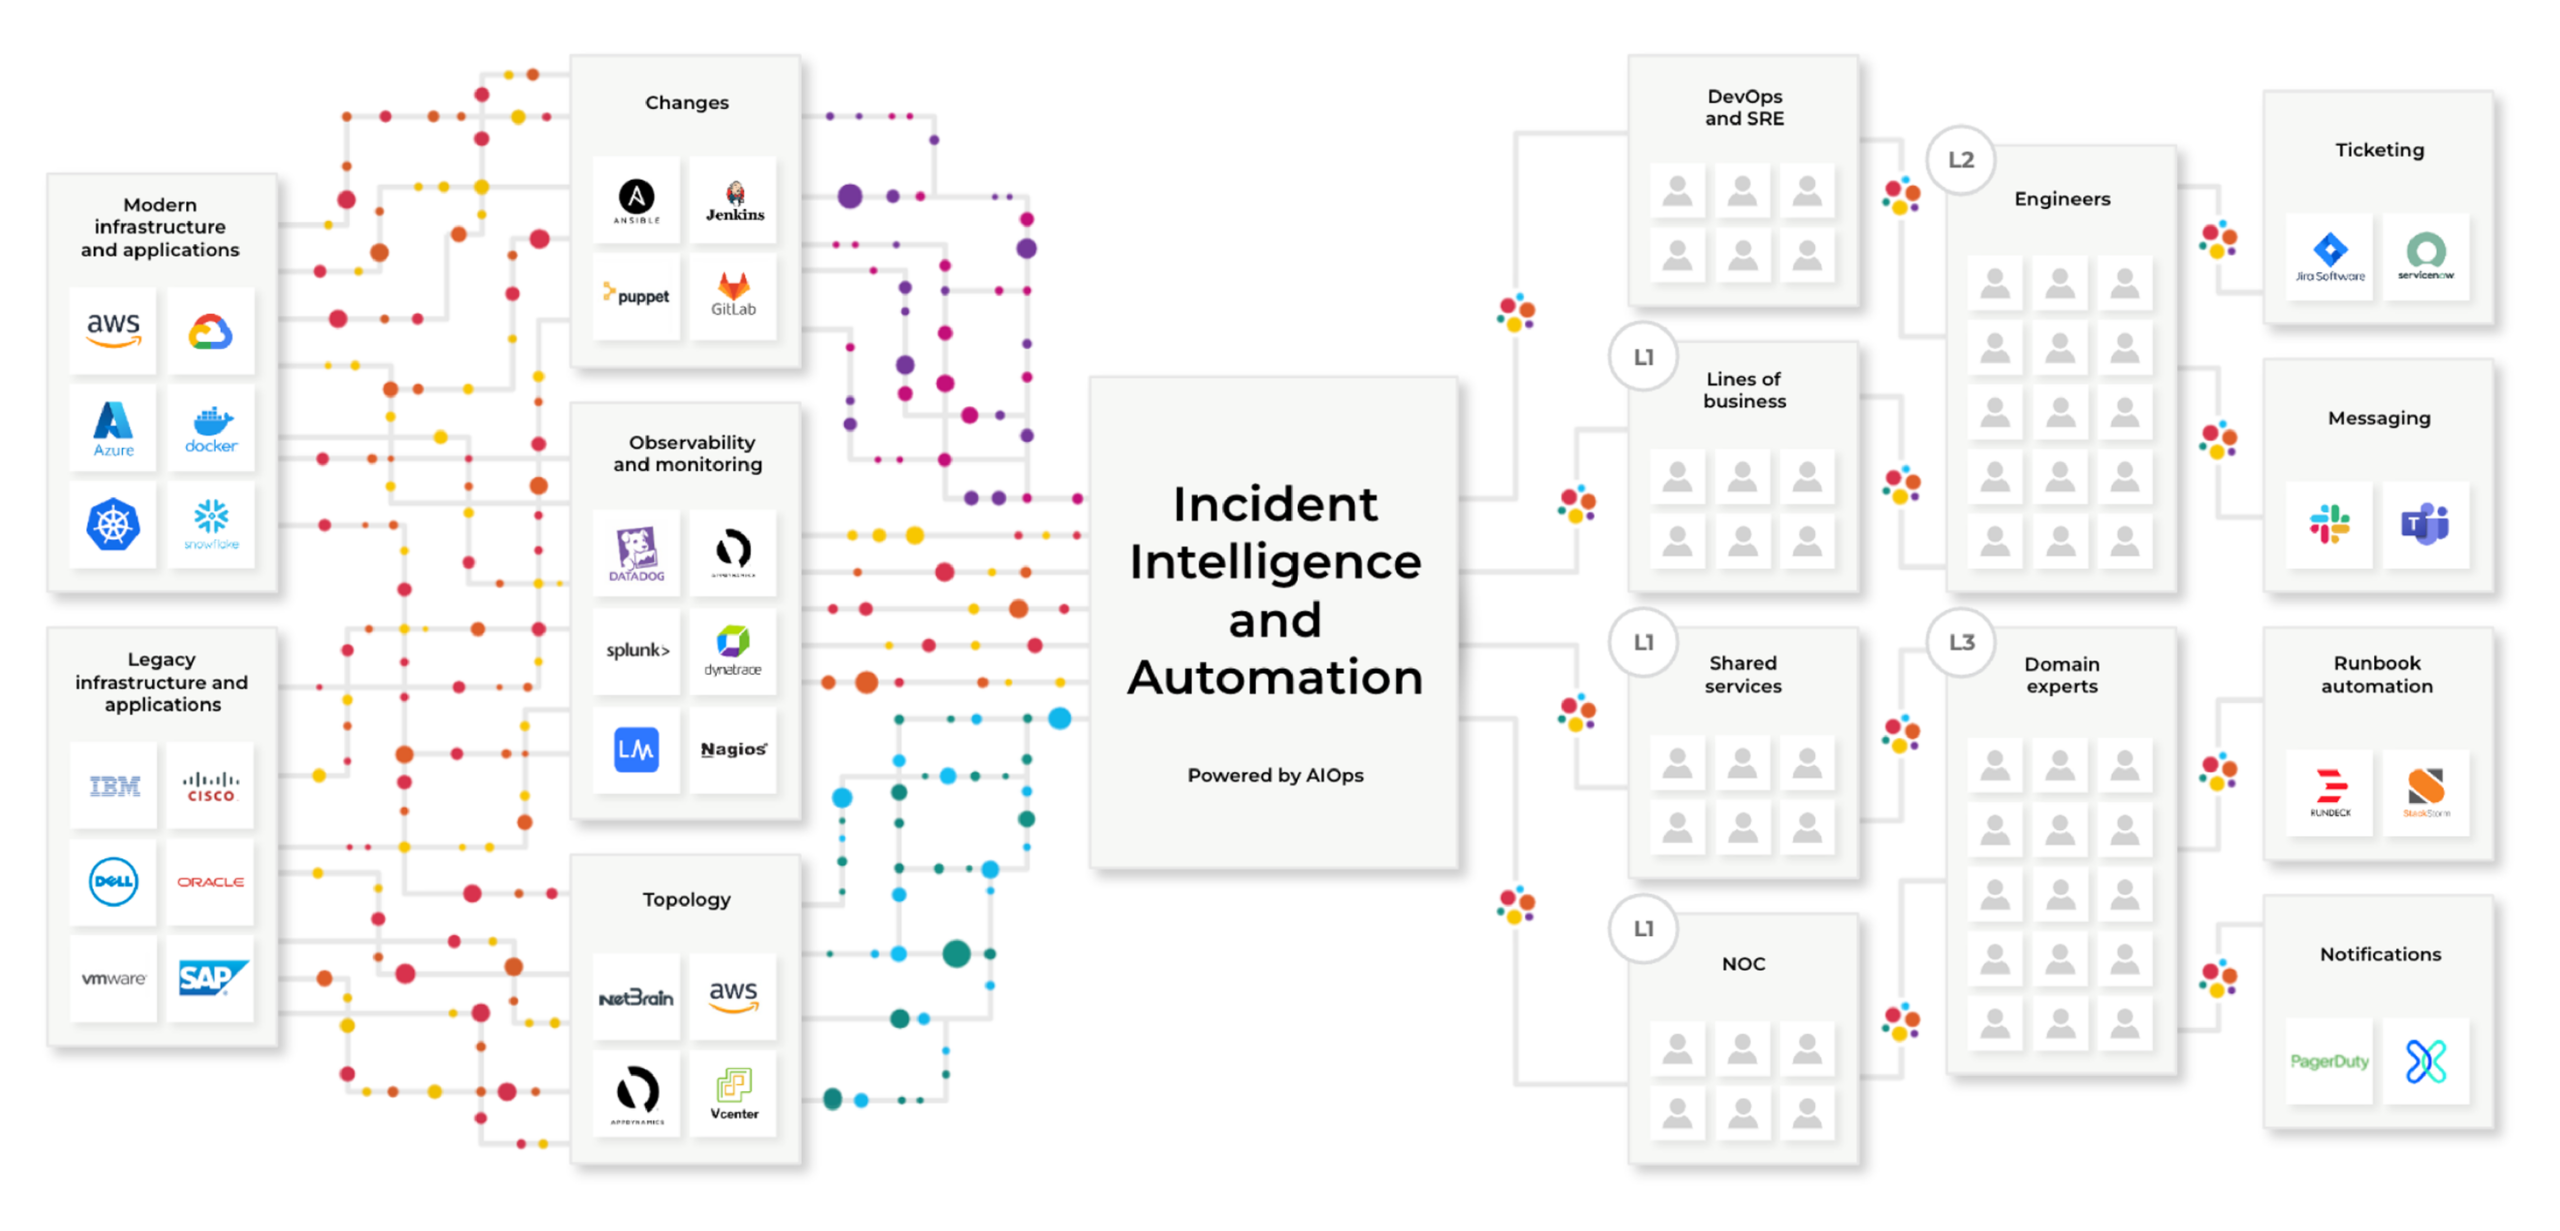
BigPanda was purpose-built for Incident Intelligence and Automation and represents a best-of-breed approach to solve the most pressing and urgent problems for enterprises, their ITOps teams, and their customers. More monitoring is not the solution. Getting more intelligence out of your existing tools is the key.
So how does BigPanda address this? One of the first steps is to centralize some of the processing that’s taking place with the data before people have to use it. That’s where this Incident Intelligence automation layer starts to play a role.
BigPanda’s AIOps can help process that data and improve its quality. There are too many missing pieces not to spend a fair amount of time improving data before it hits the consumers and before you act on it.
After all, action is expensive. As you can see in the above image, the cost of data goes up as you go from left to right. The cost starts to stack up whenever you have human intervention anywhere, even if that intervention is just copying stuff from one screen into another screen to open a ticket. Every second that ticks by, potential revenue is being lost as a customer or a sales rep or a customer support engineer can’t get to the system they need to do their job. That’s where the real cost starts to ramp up.
When you think about thousands and thousands of alerts and incidents at most large organizations, it really does add up. Even if you are very, very good at it, humans make mistakes, and they miss pieces of information. Humans will contextualize or prioritize something incorrectly or assign it to the wrong team. Then it bounces around, and the costs start to multiply.
How the insurance company went from 6M alerts to less than 50K
This brings us back to the insurance company getting 6 million IT alerts every 90 days.
When we at BigPanda first started working with them, the situation seemed overwhelming. The first thing we did—which is the first thing you should always do when you start implementing an AIOps platform—is aggregate everything. We basically ingested all the data and then did some brute force filtering.
Then we went through the Alert Intelligence phase: we used sophisticated tools to de-duplicate, filter, or suppress on the basis of maintenance actions everything coming in from every source.
Critically, that allowed us to normalize and enrich the alerts with all the contextual information we had.
Now all the alerts were coming in the same package, and the operators could see all of them on a single pane of glass. Instead of a difficult-to-maintain, homegrown alert intelligence that usually only operates across one or two different sources, we had this end-to-end Alert Intelligence module that allowed them to really fine-tune data and control it.
Then we did maintenance suppression, which is often overlooked. But anybody who’s worked in a large organization knows that if you’re running a significant firewall configuration change or a major cloud migration, you’ll kick off alerts across your system. NOCs hate that, and they just kind of deal with it. But with a good AIOps solution, you can configure it so that none of that ever appears in tickets. You suppress it as a matter of process, and it’s just taken care of from the get-go.
We dropped off a majority of the six million alerts in this phase, but we still had two problems to address:
One, after the tickets were created, a lot of them were assigned to the NOC and then needed to be escalated to Level 2 (L2) or 3 (L3) support engineers. That process caused significant delays.
Two, the organization still had a huge volume of noise alerts, which were opened, converted to a ticket, and then closed without any action. These non-action incidents were taking up a significant amount of time, especially for the Level 1 (L1) engineers.
But L1 engineers have projects they’re working on. And I know if I’m spending almost half of my time as an L1 dealing with noise, I start to question my reason for being. That type of work gets to be a really depressing endeavor and expensive for the organization. And I think anybody who’s been in an operation center sees that it can be painful day in and day out to deal with.
BigPanda AIOps system intercepted these alerts upstream, reducing the workload for the human operators. And in the end, we helped them get down to a much more manageable number of alerts.
The three pillars of AIOps success
So how can BigPanda AIOps achieve similar results for your organization? We’ve found that there are three pillars that ensure success when implementing AIOps, including:
- Open data strategy: The AIOps solution must be capable of organizing ITOps data and DevOps data, no matter how it’s generated and where it resides. This means it needs to be able to collect data from all the other sources of truth in your IT environment without any kind of preferential treatment. So you put all that data in one place, normalize it, make it consistent, define it carefully, then let everybody participate in that. That will knock down all of your tribal knowledge barriers between teams.
- Intelligence and automation: Once organized, the IT data needs to deliver intelligent insights that allow IT teams to work more efficiently, and automations that accelerate triage processes and potentially even allow critical IT services to self-heal must be mobilized.
- Fast and easy adoption: None of this matters if the solution takes forever to deliver results. The AIOps platform must be easy to adopt, empowering its users to manage it themselves. It should provide a simple user experience with built-in intelligence to streamline and reward continued usage. And it should use a pricing model that maps directly to the value realized by the customer, rather than a more arbitrary metric tied to environment size or the number of users.
We designed BigPanda AIOps and our overall system to deliver on all three of these pillars to ensure that your organization gets the best possible outcomes and efficiencies when we work together.
When you start looking at your data as an opportunity, and you improve that and make it more relevant, and you fine-tune your sources while also getting additional sources, and you continue to evaluate on the basis of actionability…then you’re on an unstoppable train of just getting better and better and better.


