


IT operations analytics: An essential guide
Data is both a challenge and an asset for IT professionals, who rely on IT operations analytics (ITOA) to guide them towards operational excellence, system reliability, and swift incident resolution.
So whether you’re seeking clarity on understanding what ITOA is and its connection to related technologies, are contemplating how to use it within your organization, or are curious about its enhanced efficiency and cost savings benefits, we’ve got you covered.
We’ll also shine a spotlight on real-world ITOA applications, providing insights and case studies that illustrate its practicality across various industry scenarios. Plus, discover how platforms like BigPanda are pivotal for IT and DevOps teams using ITOA by automating alert identification and enabling proactive incident response for better service availability. Read on to learn:
- What is IT operations analytics?
- How do IT operations analytics work?
- How analytics can improve IT services and operations
- What are the challenges of implementing ITOA?
- Applications for IT Operations Analytics
- How ITOA applies data analysis best practices
- ITOA unifies data from IT operations analytics architecture
- Four types of IT operations analytics and when to use them
- Examples of IT operations analytics reports and when to use them
- How AIOps powers today’s ITOA
What is IT operations analytics?
IT operations analytics uses data analysis techniques to analyze IT system performance. These findings help you deploy IT resources more efficiently and effectively. IT teams turn to ITOA to diagnose and fix problems more quickly, thus reducing outages.
Organizations need ITOA because the IT environment is complex and changes frequently. However, using analytics reduces complexity by making issues more visible and speeding up the troubleshooting process.
ITOA solutions look at a constant stream of data about system health. They spot signs of trouble and flag them for ITOps teams, which include centralized IT operations teams, NOC teams, and DevOps and SRE teams. Analytics helps these teams swiftly locate and diagnose problems. This streamlines processes that would be cumbersome to manage manually.
What’s the difference between ITOA, AIOps, observability, and capacity management?
While these concepts are interconnected, they have distinct functions and applications in the IT landscape. By understanding these key differences, you can make more informed decisions about your system monitoring, resource utilization, and optimization strategies.
ITOA vs. AIOps
Both analyze IT operations data — but where ITOA uses data analysis techniques, AIOps uses machine learning and artificial intelligence. This enables AIOps to improve on ITOA and be predictive, preventative, and highly automated.
ITOA vs. observability
ITOA and observability share a common goal: using IT operations data to improve system performance and operational efficiency. However, they use different processes to achieve this.
Observability focuses on understanding complex systems through external data analysis, particularly metrics, events, logs, and traces. In contrast, ITOA employs data mining and data analysis principles to analyze system data, facilitating root cause analysis and proactive issue resolution within IT operations. Both approaches contribute to enhanced business intelligence and effective technology deployment.
ITOA vs. capacity management
IT capacity management and IT operations analytics are essential components of IT infrastructure management, but they differ in focus and scope. Capacity management is primarily concerned with ensuring that IT resources are sufficient to meet current and future operational demands. It uses a structured approach that includes business, service, and component capacity management.
On the other hand, ITOA analyzes IT operations data to enhance system performance, troubleshoot issues, and optimize operations more broadly. While ITOA traditionally doesn’t include a dedicated capacity management function, some ITOA tools integrate capacity management features to offer a more comprehensive view of IT operations, enhancing their overall capabilities.
How do IT operations analytics work?
ITOA simplifies and enhances cloud operations by automating repetitive tasks and facilitating the integration of analytical insights into decision-making processes. Furthermore, it collects and processes real-time data from various sources, including applications, services, networks, operating systems, and cloud infrastructure hardware logs and workflows.
The typical ITOA process consists of six key steps:
- Define data infrastructure strategy: Determine the strategy for data infrastructure, including selecting a suitable data repository and establishing storage locations for data.
- Cleanse and optimize data: Identify and rectify issues within the data set, including duplicates, inaccuracies, corruption, and incomplete data.
- Define core metrics: Identify and prioritize critical key performance indicators (KPIs) tailored to the specific needs of the business application.
- Automate analytics tools and processes: Implement automated analytics tools and processes to extract real-time insights for the defined KPIs.
- Establish data governance: Identify data use cases and create a scalable delivery model accompanied by comprehensive documentation.
- Provide data visibility for stakeholders: Synchronize analytical insights from a data warehouse or data lake into user-friendly visual dashboards within front-end tools for easy accessibility by stakeholders.
How analytics can improve IT services and operations
IT operations is a metrics-driven function and should drive continuous improvements as a core practice. Services and sub-services break, alerts of varying quality come in, incidents are created, and services get fixed. Analytics can help IT teams improve these operations.
Through the entire incident management pipeline, KPIs can help organizations find gaps in their process, increase efficiency, and measure the performance of their people, systems, and tools.
Service downtime or its opposite — service availability and reliability — are the most critical measures that require constant monitoring and improvement.
Other benefits of ITOA include:
- Gain a comprehensive view of all IT operations
- Automated notifications for common problems
- Better decision-making
- Decreased downtime
- Efficient resource usage
- Faster troubleshooting and problem resolution
- Identify hot spots that generate the most alerts
- Improved user experience (or customer experience) and satisfaction
- Optimization of system and application performance
- Proactive identification of issues
- Quick resolution of common issues
- Reduced risk associated with system changes
However when it comes to using analytics to improve ITOps, keep in mind these pointers:
- The quantity and quality of event and alert streams vary.
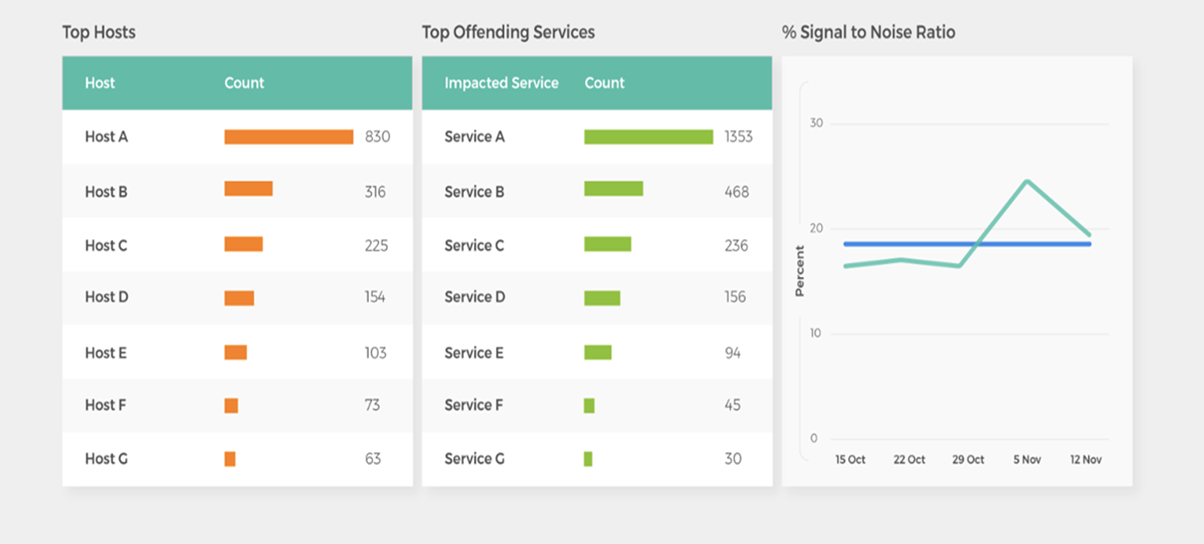
- The signal-to-noise ratio helps define how good your primary process input is. This is a measure of how many events are successfully grouped together by the event correlation software, compared to the total number of events that are processed by the software. As you implement improvements, measure the changes.
- MTTx metrics are useful. Pivot them by team, service, source, or other attribute to rapidly identify gaps.
What are the challenges of implementing ITOA?
ITOA offers significant value, but you should be prepared for the following challenges with skills gaps, data consolidation, and data accuracy. Here are some challenges to anticipate:
- Meeting skill gaps: ITOA solutions can require specialized expertise in fields like data science, AI, and machine learning. This may entail providing additional training to existing staff or hiring individuals with the requisite skills.
- Consolidating data: Organizations must effectively integrate diverse data sources into a cohesive ITOA solution. This is a complex process and IT teams have to coordinate carefully with each other and potentially other support departments like human resources.
- Data accuracy: Ensuring data quality and reliability through validation and maintenance is paramount for ITOA implementation. Inaccurate or outdated data can lead to incorrect insights.
Addressing ITOA challenges can mean equipping teams with expertise in AI and data science, effectively consolidating diverse data sources, and maintaining impeccable data accuracy to ensure reliable insights.
However, using an AIOps platform is one way to address these data gaps. AIOps advanced algorithms and machine learning automate the analysis of vast IT data sets and reduce the need for specialized expertise and upskilling. Additionally, by intelligently consolidating and enriching diverse data sources, AIOps improves data visibility by enriching data and providing a unified view of IT operations so you can explore ITOps KPIs and derive insights to help drive operational incident workflow improvements.
Applications for IT operations analytics
ITOps teams apply operations analytics in multiple ways. Some of these use cases aim to determine the causes and solutions of IT problems. Other uses focus on understanding how the system performs and how to improve its performance.
- Assist root cause analysis: ITOA helps IT teams determine the root cause of an issue. This may be hard to spot if the initial problem caused a cascade of effects or multiple issues occurred at once. Event correlation, which links problems to system changes, helps significantly. If there are multiple root causes, ITOA can rank them in priority order. This speeds up resolution and aids prevention.
- Find the right owner: Analytics helps identify the department, team, or person that is best equipped to solve the problem. That shortens time to response and resolution, compared to passing around the issue before deciding who can solve it.
- Optimize system performance: IT teams can leverage analytics solutions to understand how varying conditions affect system uptime, service availability, and overall system performance. This understanding helps ITOps anticipate how the system will act in the future.
- Visualization: ITOA models and patterns of IT infrastructure and applications can improve the understanding of system architecture, network topologies, and dependencies from other mapping and discovery tools. This knowledge helps locate the site of an issue.
- Understand business impact: Operation analytics can put issues within the context of the overall business. ITOA can highlight and prioritize problems that affect revenue generation, so the resolution of less important issues might be delayed. Since metrics for time to resolution are typically the benchmark for grading IT teams, this may require changes. But it aligns IT with the business.
- Automate action: Once you have visualization, root cause analysis, and other insights from ITOA, you can create automated response steps. For example, certain conditions, error codes, or events can trigger actions. These could include diagnostics and notifications, as well as putting a predefined runbook into action.
How ITOA applies data analysis best practices
With ITOA, you leverage the power of data analysis. It’s designed to use your company’s data, guiding you toward improved business outcomes. The key steps and best practices include gathering, storing, and organizing data — all of which ultimately enable you to perform analytics and visualizations. ITOA unifies data from:
- Data logs from the network, hardware, applications, and other system information
- Monitoring solutions
- Software agents that observe and report on the IT environment and resource usage
- Virtual machine monitoring (VMM) software, also known as a hypervisor
The information flow from these tools is characterized by the three Vs of big data: velocity, volume, and variety. The various surveillance, monitoring, and reporting solutions produce data in large quantities, at high speed, in multiple formats, and from a variety of sources. The best practice is to use an analytics tool that brings together all your data sources and provides a unified view of your entire IT ecosystem.
Data analytics technologies, like open-source frameworks such as Hadoop for data lakes and NoSQL for unstructured data stores, facilitate data analysis. IT operations analytics mines these large data volumes and finds patterns and relationships in the data. These findings are the basis for algorithmic models that spot anomalies.
Working with data this way represents a shift from the traditional approach of ITOps teams looking at data within the monitoring tool. Examining each piece in isolation leads to a fragmented view. One common pain point for teams was the need to toggle between screens to see each tool’s output.
Data analysis brings data from all the monitoring and reporting tools together, both for more effective analysis and a simplified single-pane view for end users. IT teams get a holistic picture of system performance. Doing this makes sense because the components of the system are connected, and issues in one area affect another.
Some people describe this integration as data-driven IT as opposed to tool-driven IT because the data set as a whole directs IT actions, not the output of individual tools.
This evolution is part of the trend toward integrated monitoring architecture, cross-functional teams, and continuous monitoring and improvement. In addition, continuous integration, continuous deployment, and continuous delivery of code updates increase the value of ITOA.
IT operations analytics architecture
Understanding your ITOA architecture allows you to optimize and streamline IT processes, enhancing system performance and reliability. However, to maximize ITOA performance, the architecture needs to have scalability, interoperability, security, and flexibility.
Features an ITOA analytics architecture offers include:
- Scalability: Can expand as systems and data volume grows without bottlenecks, usage restrictions, or cost barriers
- Interoperability: Works with all operating systems and programming languages; is open and nonproprietary
- Integration: Can integrate data in many ways, including APIs, middleware, and virtually; also provides uniform access and common storage methods
- Security: Does not put the organization’s systems or data at risk
- Flexibility: Integrates data of all types, from all tools, in one store
Many companies have built IT monitoring systems piecemeal, acquiring different tools for different needs such as network monitoring or applications support. This tends to result in an abundance, or even an excess, of tools. Each tool produces helpful, but siloed data. Robust ITOA demands integrating data from all sources with data analysis principles.
ITOA architecture provides complete visibility into the IT environment by working with data from all sources. These include:
- Agent data: Data from monitoring and surveillance agents, which can include agents that detect software coding errors
- Human data: Data resulting from human activity, including text, images, video, social media posts, and more; most ITOA systems can store this information, but IT Operations Analytics for this data type is immature.
- Machine data: Data reported by the system itself, such as audit logs and event tracing
- Synthetic data: Data created to test systems and services; this data emulates real data, including data that simulates customer transactions in different locations
- Wire data: Data from communications among system layers, from Layer 2 (data link) to Layer 7 (applications)
The operations analytics platform must be able to handle the following:
- Complex queries: These use multiple parameters and may require joins across multiple data tables and nested subqueries.
- High query volume: The system can serve concurrent queries.
- Live sync: The database automatically and continuously updates with new data from all sources.
- Low data latency: Updates to data are visible within a few seconds.
- Low query latency: Results are returned in near real-time.
- Mixed data: Data of different types are stored together, minimizing cleaning and reducing latency.
Four types of IT operations analytics – and when to use them
ITOA includes the four common types of analytics: descriptive analytics, diagnostic analytics, predictive analytics, and prescriptive analytics. These progress in complexity and difficulty. Descriptive analytics looks at data to describe what has happened. Prescriptive analytics answers the question, “What should we do next?”
As organizations gain experience with ITOA, they become increasingly capable and ready for a more difficult level of analytics. In an analytics maturity model, prescriptive analytics requires the most maturity.
- Descriptive IT operations analytics: This type of analytics provides information about what has happened in the IT environment. An example would be when the ITOA system detects customers having trouble checking on the company’s e-commerce site. The IT team can fix the problem before a large number of sales are lost. Another example would be looking at historical data to calculate the ITOps team’s mean time to resolve (MTTR), the average amount of time it takes to fix an issue.
- Diagnostic IT operations analytics: This helps pinpoint the source and cause of the IT problem. For example, ITOA can highlight an issue with the integration to the e-commerce site’s payment processor through root cause analysis.
- Predictive operations analytics: This tells you what is likely to happen. For example, based on historical data about past system crashes, ITOA can identify the system state, usage patterns, and other factors that are likely to cause a system outage in the future.
- Prescriptive IT operations analytics: Prescriptive analytics in ITOA enhances decision-making by using simulation and optimization algorithms. This area is less mature but improves as ITOA becomes adept at handling data ambiguity. For instance, it can recommend building a new data center based on usage patterns, network traffic, sales distribution, growth trends, and cost considerations.
Sample IT operations analytics reports and when to use them
Now that we understand the four kinds of ITOps analytics, let’s explore the application of these analytics types through some specific report examples, which detail when and how to use them effectively.
Operational analytics reports and dashboards give insights into key trends in IT operations management. Some of the most-watched items are how engineering teams and IT systems are performing. Here are a few examples of typical ITOps reports used by ITOps managers and executives:
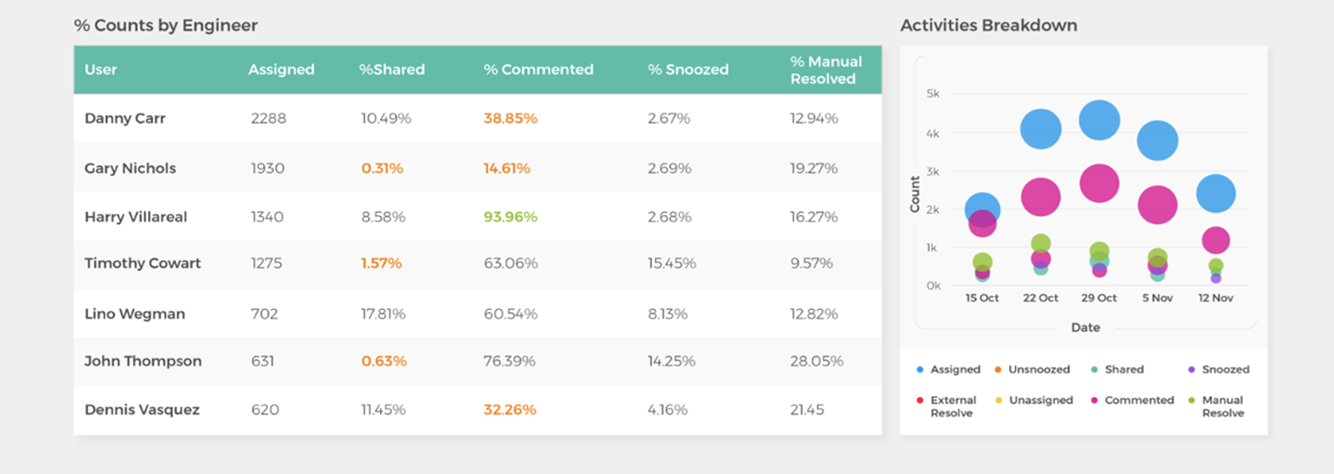
Team performance: This report shows incidents assigned to each engineer, the percentage resolved, whether the engineer resolved or escalated the issue, and more. This helps track workload balancing and team efficiency, as well as drive accountability.
Hotspots: The report helps identify services that are creating the most noise. You can combine this report with other data to determine if certain systems are providing useful event data or simply creating alert fatigue.
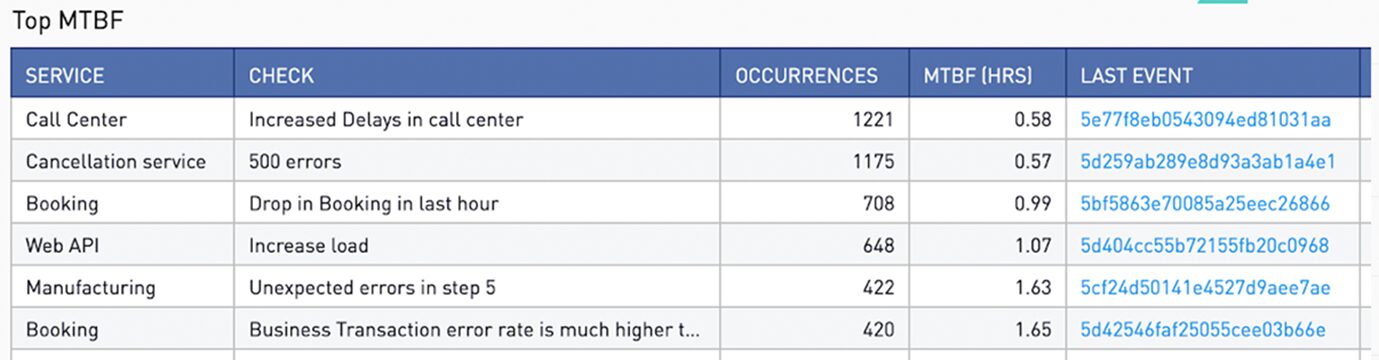
Mean time between failures: This shows the average time between failures. You can track which systems or applications take the longest to bring back online so you know where to focus improvement efforts.
Business use cases
ITOA’s most important role is to drive better business performance. This results from more reliable and efficient IT systems. Use cases demonstrate how IT analytics can impact customers and the business. With the right solution, IT operations managers can view the status of all monitoring and surveillance systems from one screen. This adds clarity and efficiency.
For instance, consider a global video gaming studio with numerous players online simultaneously. The sheer volume of alerts can be overwhelming, but ITOA consolidates repetitive issues into a single problem through compression. Analytics then correlates these issues with system changes and health conditions to pinpoint root causes.
When the company introduced a new online multiplayer game, the launch triggered 3,000 alerts. But when AIOps was applied those analytics were compressed by 99%, resulting in only 35 tickets. BigPanda made the ITOps team’s job more manageable and improved the experience for customers, resulting in a win for the business.
In another ITOA use case within the entertainment industry, a streaming service grappling with rapid change and innovation, needed to proactively detect and resolve issues before they affected customers. However, with the implementation of improved ITOA with AIOps, the company made significant strides in proactively resolving issues and reduced their alert noise by 94%.
How AIOps powers today’s ITOA
At BigPanda, we believe in the power of AIOps to transform IT operations. Our platform evaluates signal-to-noise ratios and employs MTTx metrics for rapid improvement identification. Our Unified Analytics is created specifically for IT operations and helps to streamline processes. We’re not just adapting general reporting tools for IT operations; our tools are specially designed for this purpose.
From ready-to-use KPIs to specific dashboards for different roles within IT operations, we’ve got it all. See it in action in a personalized demo of how we overcome challenges like fragmented reporting to make better, more data-driven decisions. By using IT data and analytics, you can better manage incidents and boost efficiency, ensuring your services are always reliable.