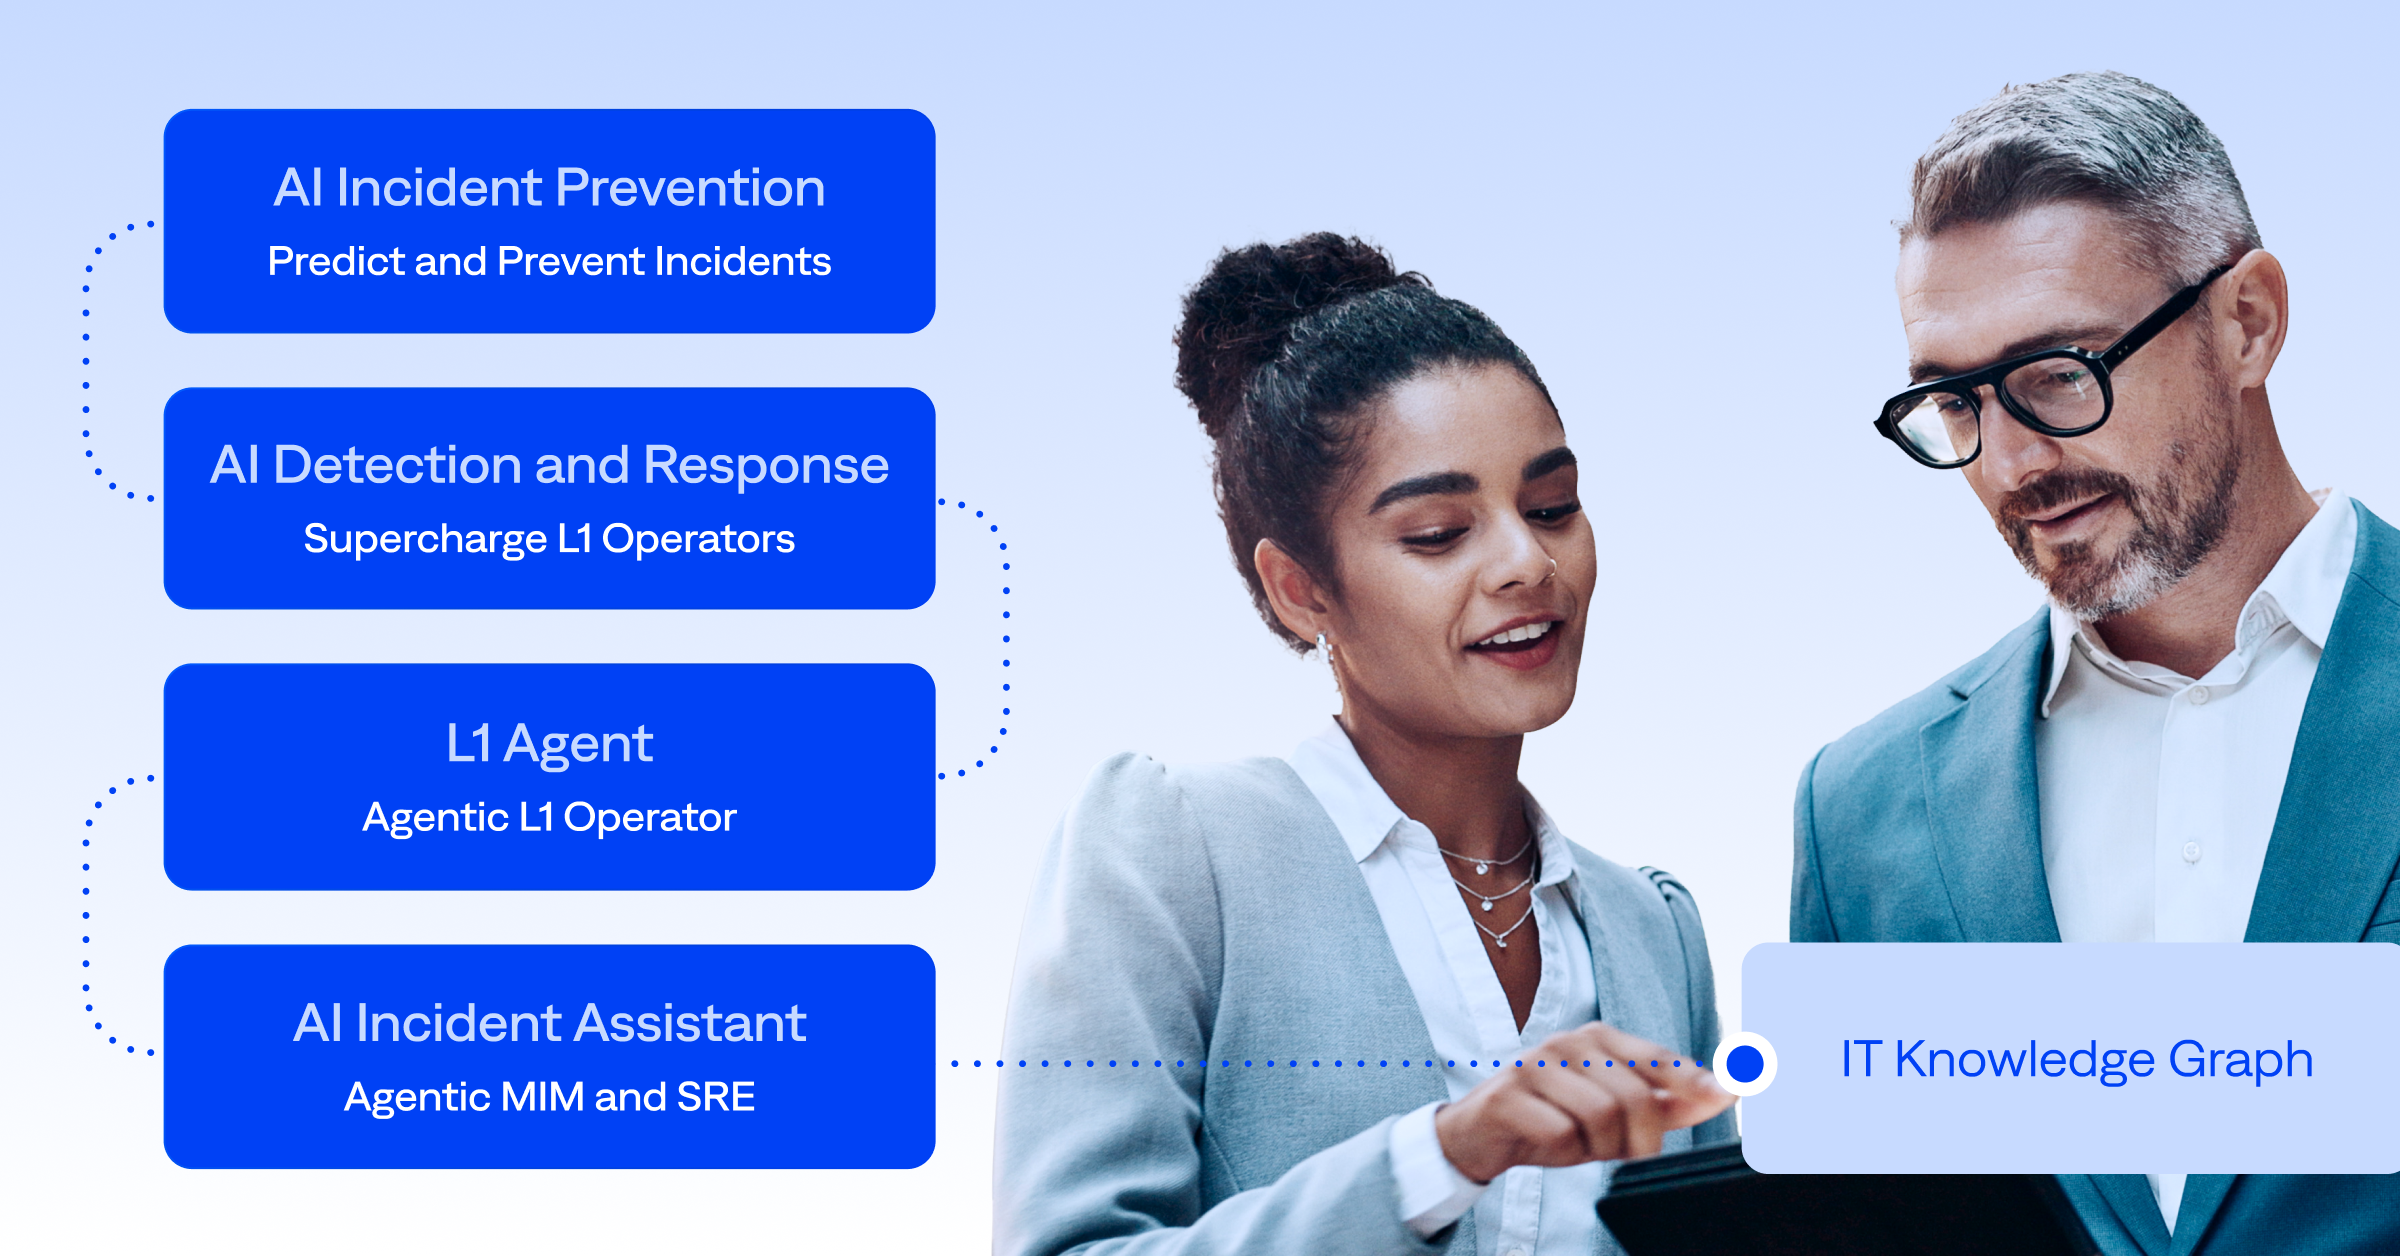


Predict and prevent IT incidents
BigPanda AI Incident Prevention uses proactive and scalable prevention intelligence to avoid IT outages and make your organization more resilient.

Learn how BigPanda stops change-related incidents before they occur
Human-executed changes are a leading cause of IT outages. AI Incident Prevention automatically scores change risks and stops incidents before they start.
Stop incidents before they start
BigPanda AI Incident Prevention helps reduce repeat incidents, mitigate change risk, and strengthen operational resilience with continuous AI learning and insight.
Predict change-related incident risk
The change risk dashboard uses AI to analyze proposed changes, predict potential issues, and enable proactive adjustments that minimize change-induced incidents and costly rollbacks.

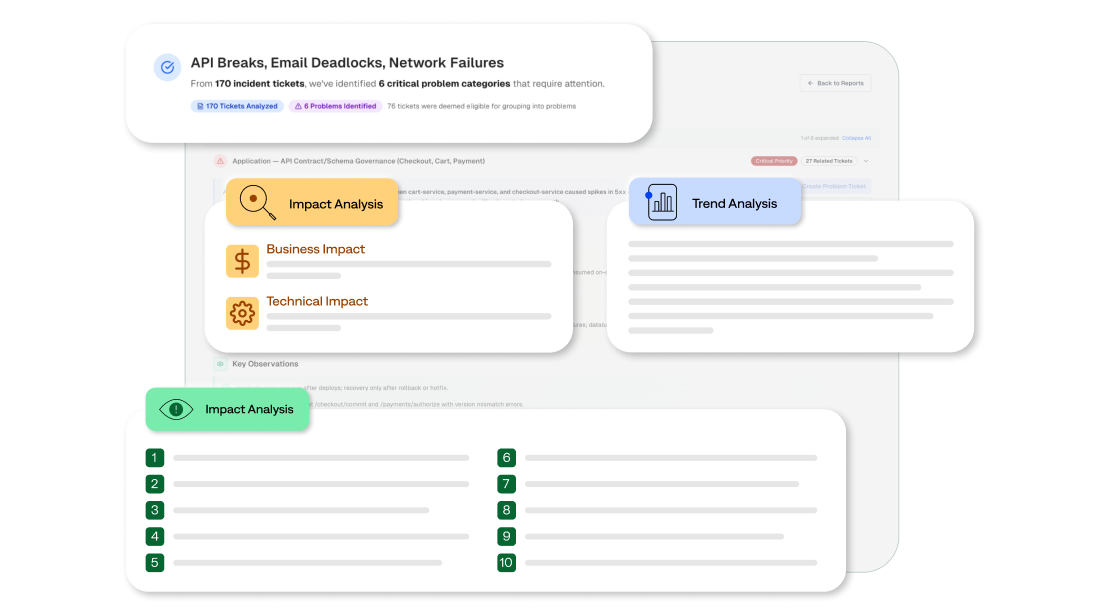
Proactively identify and resolve recurring issues
BigPanda problem management identifies underlying patterns and uncovers the root cause of repeat incidents, enabling your teams to implement permanent fixes that prevent future occurrences.
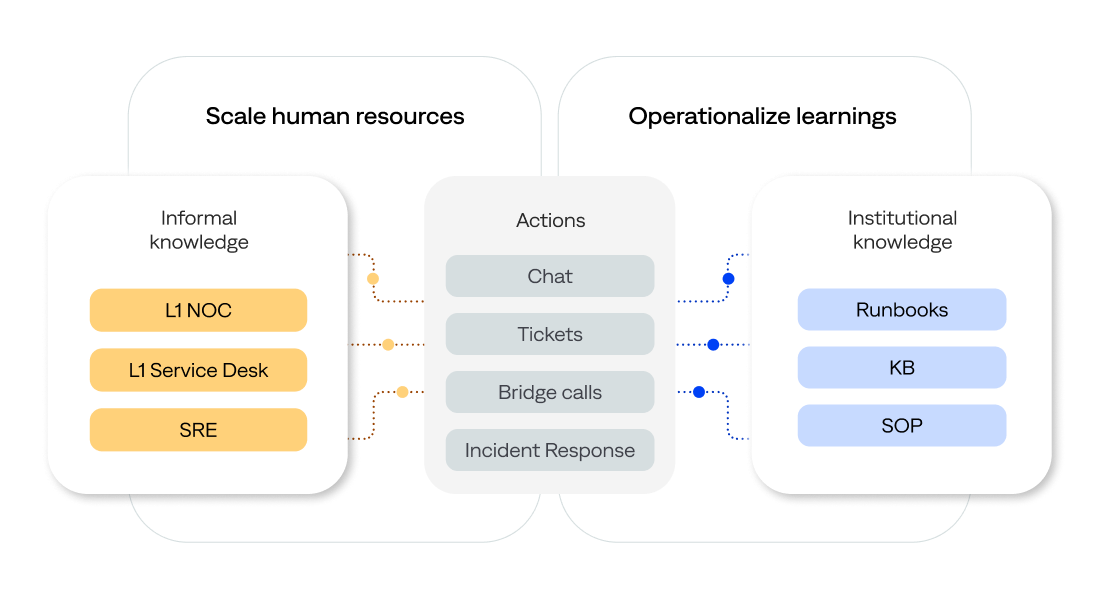
Operationalize learnings and insights
BigPanda AI Incident Assistant automatically analyzes and synthesizes all incident-related data—including from ITSM tickets, collaboration tools such as email and messaging, and bridge calls—to capture, operationalize, and apply lessons learned that can help prevent repeat incidents and enhance agentic AI recommendations.
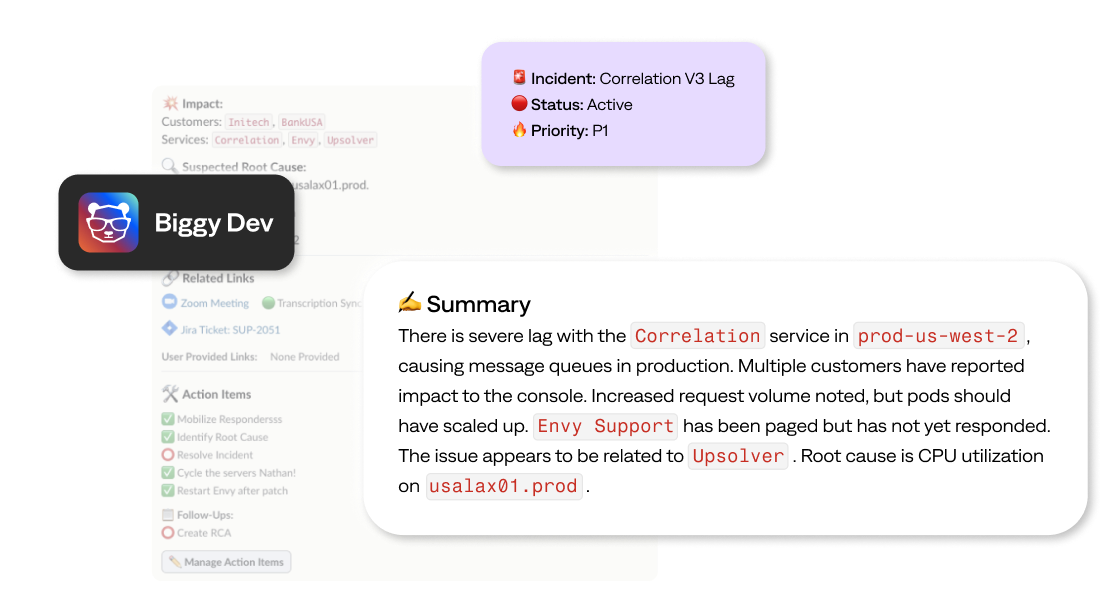
Automate incident reports
AI Incident Assistant automatically generates comprehensive post-mortem reports, consistently documenting root causes, timelines, and actions taken. These post-incident reports help your teams understand why the incident occurred, what was affected, and how it can be prevented in the future.
FAQ
Can BigPanda prevent change-related outages?
Yes, BigPanda helps your teams prevent change-related outages by using AI to analyze proposed changes and compare them with past incidents. Then, through the change risk dashboard, it recommends preventative actions and predictive insights to minimize change-induced disruptions.
How does BigPanda help prevent future incidents?
BigPanda problem management analyzes trends and patterns to provide predictive IT insights and identify recurring issues and potential risks. It enables your teams to resolve incidents proactively and prevent future service disruptions.
Can BigPanda show the downstream impact of changes?
Yes. BigPanda change risk management correlates changes with related incidents, service dependencies, and historical patterns to reveal the true downstream impact. This helps teams accurately assess change risk, understand the potential blast radius, and take preventive action before users or critical services are affected.
How does BigPanda help teams investigate issues faster?
The BigPanda IT Knowledge Graph brings together data from observability, ITSM, change management, and collaboration tools, along with historical incidents, to provide immediate context. Teams can quickly identify patterns, contributing factors, and likely root causes, which reduces the need for repeat investigations and speeds incident understanding.
Check out more related content
ANALYST REPORT
Real-World Incident Response, Management, and Prevention


- PlatformPlatform
- Agentic IT Operations
- Platform Overview
- AI Incident Prevention
- AI Detection & Response
- L1 Agent
- AI Incident Assistant
- IT Knowledge Graph
- BigPanda AIOps
- BigPanda Core
- Advanced Insight
- Biggy AI
- Rebranding Matrix
- Integrations
- Security & Compliance
- Features
- Detection
- Open Integration Hub
- AI Detection
- Diagnosis
- Service Desk Correlation
- Suggested Actions
- Incident Correlation
- Triage
- Automated Incident Triage
- Root Cause Analysis
- Similar Incidents
- Prevention
- Change Risk Management
- Problem Management
- Solutions
- Automating L1 Detection & Response
- Empowering Experts with AI Assistance
- Predicting & Preventing Disruptions
- Personas
- IT operations
- Incident management
- IT service management
- Site Reliability Engineering
- Industries
- Financial services
- Manufacturing
- Insurance
- Media and entertainment
- Managed services
- Airlines
- All industries