


How ITOps can demonstrate business value with Unified Analytics

As an IT Ops exec, imagine your jubilation upon learning that after a year of hard work across your NOC, DevOps and SRE teams, you are able to automate incident response by 25%.
You’re elated as you enter your CTO’s office to share this information, and their response is:
“And your point is?”
If that sounds familiar, you’re not alone.
According to Gartner’s 2022 Market Guide for AIOps Platforms, “One of the main barriers to implementing artificial intelligence for AIOps platforms is the difficulty measuring their value and lack of benefits derived.”
There are a host of reasons why IT organizations struggle to articulate value-based outcomes from their efforts. Based on our experience helping organizations, they typically include:
- Siloed IT Ops data and teams. Each observability, change and topology tool generates data in different formats. Customers don’t want to build and maintain a data warehouse.
- Lack of self-service analytics. IT Ops need a user-friendly way to create, convey and report on unique operational KPIs.
- Unknown KPIs. Leaders often lack experience establishing and measuring the right operational KPIs and how they align with incident response best practices.
The next challenge is how to translate the operational metrics into business impact. IT executives know they need a data-driven approach to demonstrate cost savings, service ability and team efficiency improvements. But it’s not always clear what to measure, how to visualize it and how to tell a story using the data.
Until today.
BigPanda’s Unified Analytics for IT Ops
Today, BigPanda is excited to deliver IT Operations all the tools they need to not only measure but articulate the value of their improved IT Ops performance. Our new, out-of-the-box (OOTB) value dashboard demonstrates business impact by providing new insights from operational alert data.
The four tenants of our new, modern Unified Analytics platform for IT Ops are:
- Unified IT Ops data: Complex IT Ops alert data is automatically ingested, normalized and tagged into a single pane of glass that makes analytics easy. No data warehouse needed.
- End-to-end visibility: A new, purpose-built data model makes it easy to understand incident management breakdown and categorization without complex calculations.
- Self-service analytics: Create unique—or customize existing—OOTB operational dashboards with an intuitive, drag-and-drop interface.
- KPI exploration: Easily explore IT Ops KPIs to ask questions so you can drive better operational improvements and outcomes.
New capabilities that translate IT Ops metrics into business impact
For years, we’ve supported OOTB dashboards that measure, track and display common IT Ops KPIs according to industry best practices, including alert analysis, enrichment and MTTx breakdown.
Each helps customers track and measure initial key operational metrics. However, we know IT organizations need to take these data points and articulate the impact to the business. We wanted to remove the guesswork for our customers.
Today, as part of our revamped Unified Analytics offering, we are proud to announce new, ready-to-use, persona-based KPIs and a dashboard that helps IT organizations better demonstrate the business impact of using AIOps to standardize workflows and improve response times.
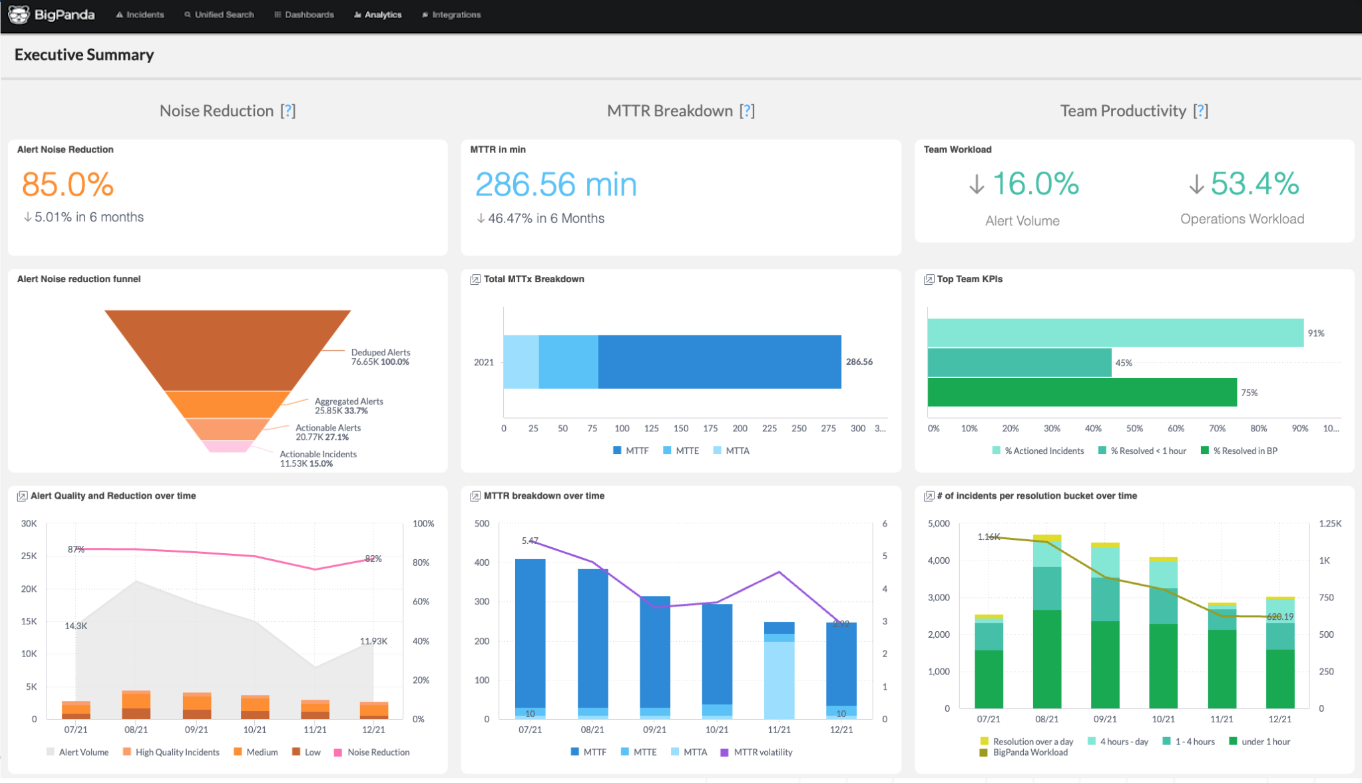
BigPanda’s ‘Executive Summary’ dashboard (pictured above) delivers new metrics and KPIs that are vital for IT Ops planning and management, including noise reduction, service availability and team productivity. Customers can filter and segment dashboard metrics based on specific segments, critical infrastructure and more.
The dashboard is broken into three use cases:
- Noise Reduction: VPs of IT can now measure alert quality from each monitoring tool and connect the impact of high, medium and low quality alerts on noise reduction and actionability.
- MTTR Breakdown: Directors of IT can now show the consistency—or disparity—in NOC activity by tracking the progress of standardizing incident response across teams and see how it impacts MTTR.
- Team Productivity: VPs of IT can now measure team productivity and workflows to support a greater volume of alerts and incidents from more products and services with fixed SLAs.
Another value use case BigPanda’s Unified Analytics addresses is monitoring tool rationalization and optimization.
We hear from many organizations that they need to “get their monitoring fixed first” before they can take advantage of event correlation (a topic we have written about previously).
But how would you know which monitoring tools to rationalize and which to keep without data to guide you?
Imagine if you could link inbound alert data from your monitoring and observability tools with operator action. Was the alert of low-quality? Was it ignored as noise? Did the alert have just enough technical context to warrant support-operator action as a medium-quality alert? Or lastly, did the alert meet a high-quality threshold for actionability that includes both technical and business context, such as priority and routing information?
With Unified Analytics, you can now measure the impact of alert quality on IT Operations and better understand which monitoring tools are delivering the most value. Here’s how:
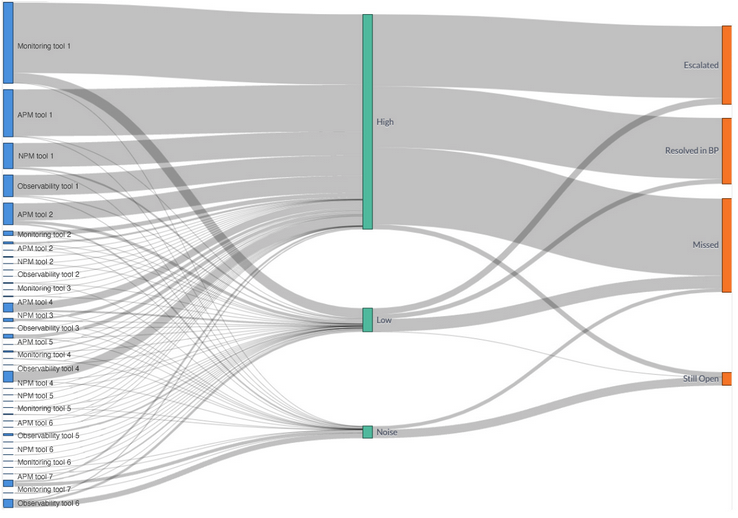
The Sankey diagram above shows various monitoring tools that an organization might support. As we can see, some tools generate a lot of alerts that are categorized as high-quality due to specific operational, topological or other contextual information that enriches the alert (middle bars in green). Other tools generate less alerts, and have lower quality, or are simply considered noise. They are often missed and/or are still open (as seen on the right bars in orange), driving MTTR through the roof.
Based on these insights, organizations can now make data-driven decisions that your CxO will appreciate:
- Optimize monitoring tools that deliver low-quality alerts from high volume sources with better enrichment across operational, topological or other contextual data that deliver better service and availability through faster MTTx.
- Retire monitoring tools that deliver low-quality alerts or noise from low-volume sources with existing tools that deliver better coverage and high-quality alert payload data.
Which IT Operations KPIs do you need to translate into business value?
We built BigPanda’s Unified Analytics to help our customers create their own path to measuring IT Ops outcomes using data. We understand, of course, that each team has a different path to traverse, each relying on different skills and assets as part of their data-driven culture.
It’s important to us that we meet each of our customers where they are now and where they want to go in the future. We’re confident that the four tenants of our modern analytics platform meet that need, and we’re just getting started. We are working on additional use cases that we will continue to share as they are available.
In the meantime, we’d love to hear from you. What KPIs and metrics do you want to create a story around their business impact to your organization? Comment below with your thoughts.
Related
Want to hear how Sony Playstation is translating IT Ops metrics into business value? Join us for our upcoming webinar with Priscilliano Flores, Staff Software Systems Engineer at Sony Playstation.
Disclaimer and Attributions
Gartner Market Guide for AIOps Platforms, Pankaj Prasad, Padraig Byrne, Gregg Siegfried, 30th May 2022.
Gartner does not endorse any vendor, product or service depicted in its research publications and does not advise technology users to select only those vendors with the highest ratings or other designation. Gartner research publications consist of the opinions of Gartner’s research organization and should not be construed as statements of fact. Gartner disclaims all warranties, expressed or implied, with respect to this research, including any warranties of merchantability or fitness for a particular purpose.
Gartner is a registered trademark and service mark of Gartner, Inc and/or its affiliates in the US and international and is used herein with permission. All rights reserved.