


1
What is event correlation?
AIOps can help manage the chaos of reviewing IT events and alerts by uniting disparate tools, data, and teams. Event correlation automates the analysis of monitoring alerts from networks, hardware, and applications to detect incidents and issues. Along with helping mitigate information overload and reduce alert fatigue, it can help improve overall operational efficiency and minimize downtime.
Event correlation tools:
- Monitor alerts, alarms, and other event signals
- Detect meaningful patterns within large, complex data sets
- Spot abnormal events that indicate problems
- Identify incidents and outages
The result is faster problem resolution, which enhances system stability and uptime. Meanwhile, AI and ML enhance the process by continuously improving algorithms using data and user input. It’s all part of how AIOps makes event data analysis and problem detection more efficient.
2
What problems can event correlation address?
Organizations depend on IT systems for nearly all operations, notably serving customers and generating revenue. Some IT issues threaten efficiency, customer service, and profitability, making correlation a critical tool to support performance, increase reliability, and decrease outages.
The stakes are high. In its 2024 survey, EMA Research found that unplanned downtime costs average more than $14,500 per minute. That cost rises to $23,750 per minute of downtime for organizations with over 10,000 employees.
Beyond service availability, you can use event correlation to address:
- Complex IT environments: Consolidate diverse alerts and data sources, providing a unified view for efficient oversight and management of intricate IT setups.
- Incident detection and resolution: Accelerate incident remediation by identifying patterns and root causes through constant alert monitoring to minimize downtime.
- Alert fatigue: Filter and prioritize alerts to reduce the overwhelming volume of notifications your IT teams receive. Fewer alerts mean more time to focus on critical issues.
- Reliability and uptime: Proactively identify issues and speed up problem resolution to reduce downtime and support higher system and service reliability.
3
Use cases for event correlation tools
The right tool can improve resilience and help teams move from reactive to proactive responses. Additional downstream benefits include automating key processes, speeding resolution, and enhancing root-cause analysis. Best-in-class tools
- Ingest event data
- Perform deduplication
- Isolate significant events from noise
- Analyze root causes
- Prioritize responses based on business objectives
Collecting all types of data from various sources helps break down silos which allows a better view of the whole picture.
Event correlation and observability
Observability platforms offer anomaly detection. Event correlation in an AIOps platform takes that information to the next level. Anomaly detection examines individual metrics to identify abnormal states. When they spot anomalies, observability tools generate an event that signals the anomaly.
Observability-based event correlation effectively reduces alert noise and connects related events from platform and telemetry data. However, observability platforms are less effective at ingesting other observability data and correlating seemingly disconnected events.
AIOps uses AI and ML to provide comprehensive analysis of event data. AIOps platforms can draw on data from multiple network resources, including storage devices, servers, user devices, and cloud infrastructure. AIOps use data aggregation to gather and centralize data — breaking down silos between sources and providing systemwide event insights.
Event correlation in integrated service management
Integrated service management distills the core principles of the Information Technology Infrastructure Library (ITIL), focusing on six key processes:
- Service-level management
- Change management
- Operations management
- Incident management
- Configuration management
- Quality management
Event correlation is an element of incident management but relates to all six processes. Event correlation is an important part of integrated service management. It connects related incidents to give a clear view of system health and performance. This holistic approach enables timely responses, minimizes disruptions, and promotes seamless service delivery.
Events and system monitoring
Understanding system-monitoring information gets harder as your IT systems grow more complex and event data increases. Challenges come from:
- Changing the arrangement of nodes, devices, and connections, their relationships to each other, and their interdependencies
- Combining cloud-based and on-premises software and computing resources
- Practicing decentralization, virtualized computing, and processing increases data volumes
- Adding, removing, or updating applications and integrating them with legacy systems
As a result, ITOps and DevOps teams struggle to manage the high number of alerts. This makes it difficult to find incidents and outages before they affect revenue-generating services or critical back-end systems. These factors raise the risk of incidents and outages that can hurt your organization’s business.
Event correlation collects monitoring data from across the managed environment. It uses AI to create clusters of alerts related to the same issue. The platform uses the latest topology data to identify and compare the clusters with system change data. It uses the information to find root causes and solutions more quickly and thoroughly than human technicians could do manually.
4
Event correlation steps
The steps efficiently process massive event data streams, allowing timely anomaly detection and ITOps response.
Step 1: Aggregation
Aggregation gathers monitoring data from different monitoring tools into a single location. You can integrate multiple sources into the solution so all data is easily accessible.
Step 2: Filtering
You can filter data before combining events. However, the more generally accepted approach is to do it after aggregation.
Step 3: Deduplication
Deduping removes repetitive notifications and alerts to isolate actual issues. For example, if 1,000 users encountered a particular error message over two hours, the process would generate 1,000 alerts. Likewise, a monitoring tool may create hundreds of alerts about a single issue —such as a full disk drive — until the problem is resolved.
“We had many duplicate, redundant alerts and no way to centralize monitoring visibility,” said Steve Liegel, director of infrastructure and operations for WEC Energy Group. “This could lead to a single incident generating multiple tickets spread across different teams, causing confusion about task ownership.” Learn how WEC Energy Group achieved 98.8% deduplication and 53.9% correlation of alerts to incidents with BigPanda.
Step 4: Normalization
Normalization ensures that monitoring data from different sources is presented in a consistent format for correlation. For example, one monitoring tool may label something a “host,” while another calls it a “server.” Normalization may use “affected device” to refer to both fields so correlation interprets it the same way regardless of source.
Step 5: Root-cause analysis
Once normalized, the tool looks for relationships and patterns among events to identify the underlying cause. AI-driven machine learning accelerates and automates this process. The system compares the event information with log information on IT architecture, configuration, and software changes. This systemwide visibility is critical: Experts agree that changes cause most IT incidents. The best AIOps platforms provide automated root-cause analysis to identify sources and steps to resolution in real time.
5
Event types
You may collect and correlate events based on IT environments and business needs. Common events, such as those in operating systems, data storage, and web servers, include the following:
- System events describe unusual states or changes in computing system resources and health, such as high CPU load or full disks.
- Operating system events come from systems like Windows, UNIX, Linux, and embedded systems like Android and iOS.
- Application events arise from issues with specific software, so they cover a broad range of use cases. For example, events may occur in a business-activity app that presents and analyzes real-time data on critical processes. In a retail scenario, they may relate to e-commerce transactions. In healthcare, they could result from a problem with a provider’s post-visit notes.
- Database events occur in the reading, updating, and storing of data in databases.
- Web server events relate to the hardware and software that deliver content to web pages.
- Network events involve devices and indicate the health of network ports, switches, routers, or other equipment. They may represent when network traffic goes over or under certain thresholds.
Other event types include synthetic checks, or probes, that monitor functionality from outside the IT environment. Real-user monitoring and client telemetry tools generate specific events as users interact with your systems.
6
Event correlation KPIs and metrics
It’s not surprising that compression is the primary KPI for a process that compresses many events into fewer incidents. This rate ideally approaches 100%, but perfect rates can compromise accuracy, leading to incorrect groupings or missed connections.
Aim to balance accuracy and compression rate (70% to 85%). Although rates of 85%, or even 95%, are possible, it’s essential to prioritize business value. Use correlation analytics to assess the efficacy of event management using raw event volumes, deduplication improvements, and signal-to-noise ratios. With these insights, you can enhance event-management effectiveness and proactively identify and address hardware and software issues.

Good event correlation can positively affect other metrics. For example, it can help ITSM leaders evaluate incident handling by automation, service teams, engineers, and DevOps staff.
Among these is a group commonly referred to as MTTx KPIs because they all start with “mean time to.” These include MTTR, MTTD, and others. Other valuable measurements include:
- Event management: Raw event volume compared to decreases through deduplication and filtering
- Event enrichment: Percentage of alerts enriched and degree of enrichment, signal-to-noise ratio, or false-positive percentage
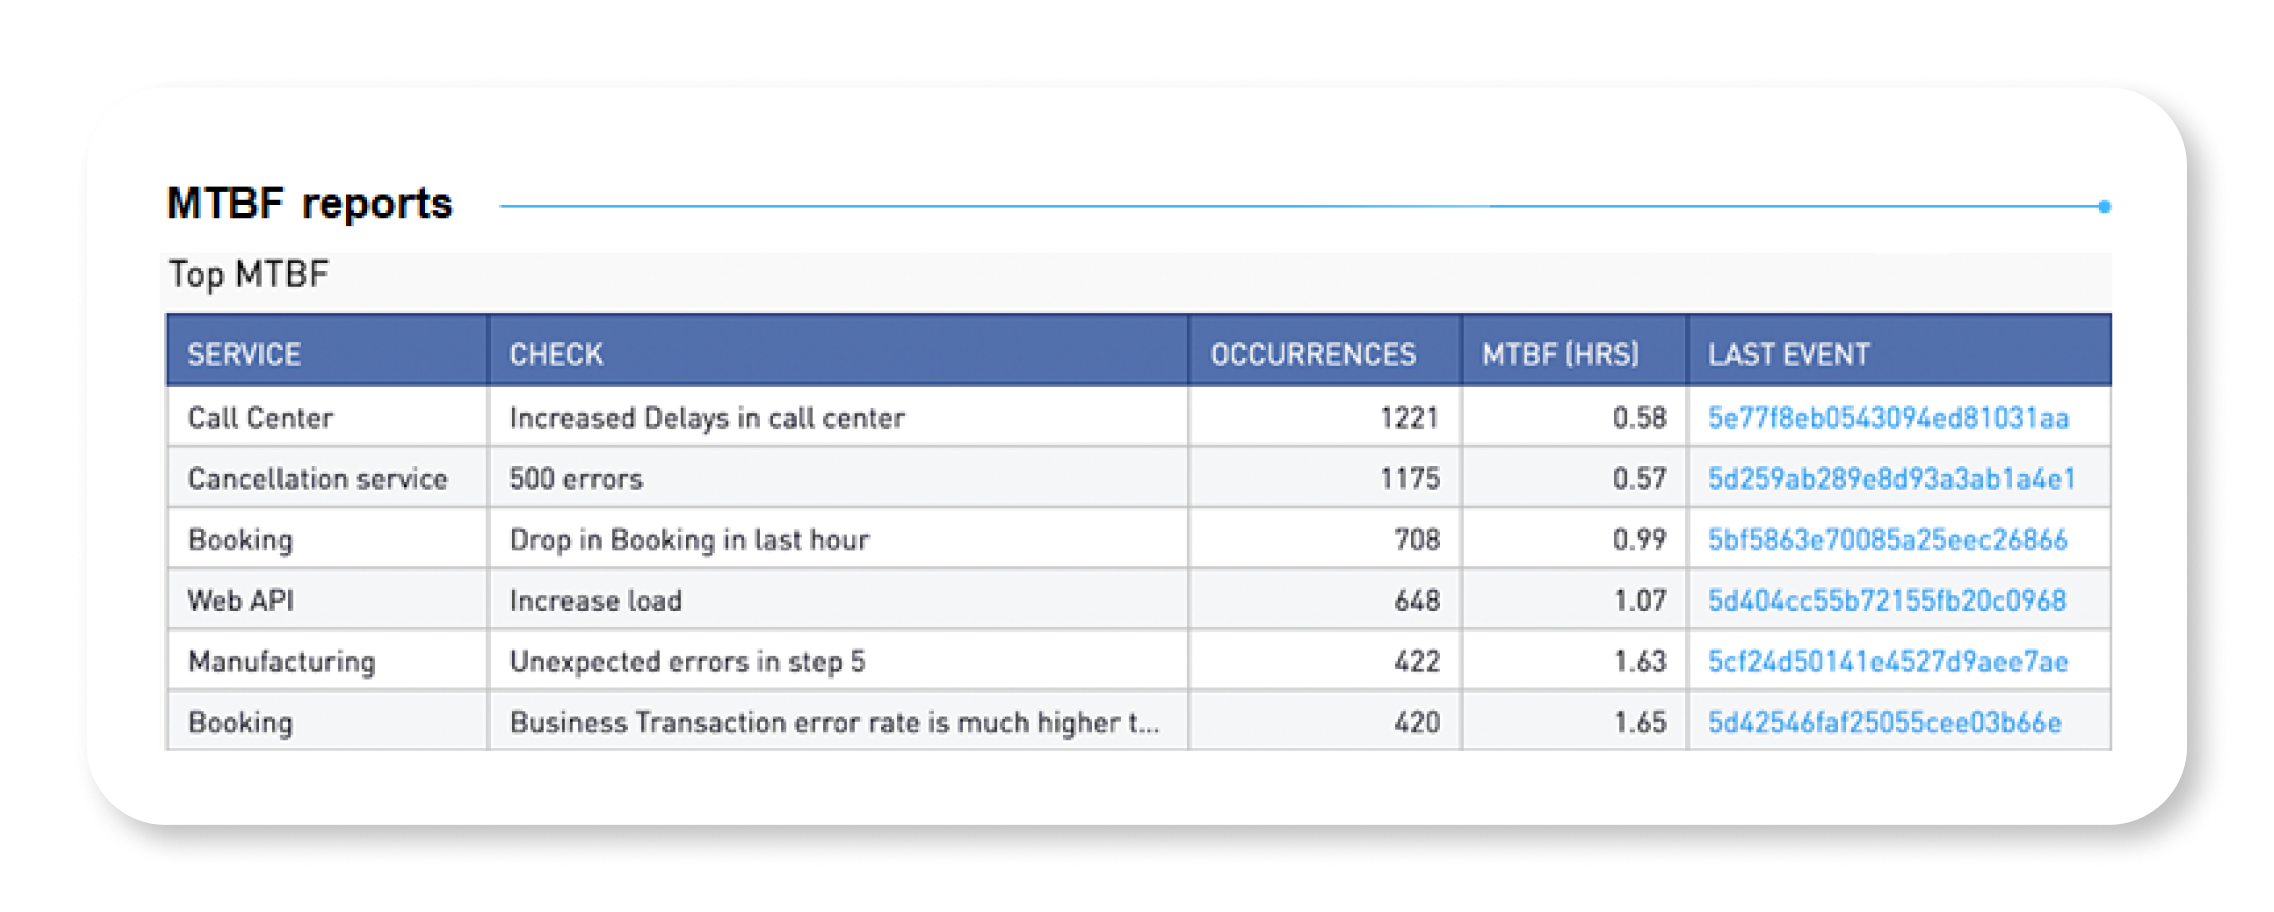
- Mean time between failures: Higher MTFB numbers indicate greater reliability (unlike its MTTx cousins)
- Specific event frequency: Noise and improved actionability
- Overall monitoring coverage: Percentage of incidents initiated by monitoring tools
However, your organization’s specific needs and benefits are unique. At best, vendors can forecast a range of potential percentage improvements in MTTx metrics.
7
Industry-specific use cases
Event correlation platforms help operations teams improve application and service reliability. They can create better experiences for internal and external customers to support stronger business outcomes such as increased revenue.
Event correlation can provide industry-specific benefits as well. For instance:
- Transportation: A prominent airline was facing costly downtime. It streamlined its monitoring tools and implemented AI-driven event correlation. This change led to centralized monitoring, fewer escalations, and a 40% drop in MTTR.
- Manufacturing: An athletic apparel company improved incident identification and correlation by adopting ML-based solutions. Within 30 days, the company decreased MTTA from 30 minutes to 1 minute.
- SaaS: A provider increased its incident resolution rate by 400%. In addition, the provider reduced MTTA by 95% and MTTR by 58% in the first 30 days.
- Retail: A national home-improvement retailer reduced average outage duration by 46%. Major incidents decreased by 27%, root cause identification increased by 226%, and MTTR improved by 75%.
8
Case study: Zayo
Global communications infrastructure platform Zayo faced challenges with its event management. Teams wasted time chasing false positives, duplicates, and benign alarms across various tools and terminals. Zayo unified its technology stack with BigPanda to filter out 99.9% of events. Zayo now has a clean and manageable data flow that equips it to scale its IT and grow its business like never before. Read the full Zayo case study.
9
Approaches and techniques
Techniques focus on finding relationships in event data and identifying causation using event characteristics, such as when they occurred, where they occurred, the processes involved, and the data type. AI-enhanced algorithms play a large role in highlighting patterns and relationships and pinpointing the source of problems.
- Time-based event correlation: This technique finds relationships between timing and event sequences. It examines what happened just before or at the same time. You can set a time range or latency condition for correlation.
- Rule-based event correlation: This approach compares events to a rule that has specific values for things like transaction type or customer city. Because you need to write a new rule for each variable, it can be time-consuming and unsustainable over the long term.
- Pattern-based event correlation: This uses time- and rule-based techniques to find events that match a defined pattern. It doesn’t require specific values for each variable. Although it’s easier to use than rule-based correlation, you have to continuously enhance the tool with ML to expand its knowledge of new patterns.
- Topology-based event correlation: This approach relies on network topology — or the physical and logical arrangement of hardware — and understanding how the elements connect. It’s easier to visualize incidents in context when they’re mapped to affected nodes or applications.
- Domain-based event correlation: This method connects event data from systems related to IT operations. These can include network performance, application performance, or computing infrastructure. Some tools ingest data from all monitoring tools for cross-domain or domain-agnostic correlation.
- History-based event correlation: Similar to pattern-based correlation, this method looks for matches between new and historical events. History-based correlation relies on past events for comparison, whereas pattern-based is flexible and evolving.
- Codebook event correlation: This technique codes events and alarms into a matrix and maps them to alarms. Issues have a unique code based on the mapping. Events are correlated to see if they match the code.
10
How to pick the right event correlation tool
The right solution enables your ITOps team to deliver better business value. However, competing claims and opaque technology can make it hard to know which tool best matches your needs. To start, tool integration should be quick and easy. A small internal or vendor team should be able to set up integrations in days, not weeks or months, without expert help.
Checklist: Key features of event correlation
Compare vendors on different dimensions, weighted by importance to your organization.
- User experience: Assess security, ease of access, intuitive navigation, user interface, unified console, native and third-party analytics, and user-friendliness.
- Functionality: Assess data sources, event types, observability and monitoring. Evaluate changes, topology tools, data ingestion, interpretation, normalization, suppression, enrichment, and deduplication. Identify root-cause detection, correlation methods, and incident visualization.
- AI and ML: Consider level-0 automation, scalability, agility, performance, integration capabilities, extensibility, and security.
- Strategic factors: Examine alignment with your organization’s vision, roadmap, business model, team culture, industry strength, financial stability, and customer satisfaction.
- Partners: Evaluate integration with observability, topology, and collaboration tools; systems integrators; resellers; and cloud providers.
- Service: Review proof of value, implementation timeline, education and training options, advisory services, customer success programs, and support SLAs.
11
The power of BigPanda for event correlation
Choosing the right tool is vital to enhance your operational responses. It’s a choice that can transform your IT management experience. BigPanda offers best-in-class event correlation capabilities to help organizations reduce IT noise by 95% or more. It enables real-time detection of incidents as they develop and before they escalate into outages. Empower your ITOps team to focus on high-value work.
Next steps
Learn more about BigPanda Event Correlation and get the data sheet.
Explore case studies about BigPanda customers using Event Correlation: