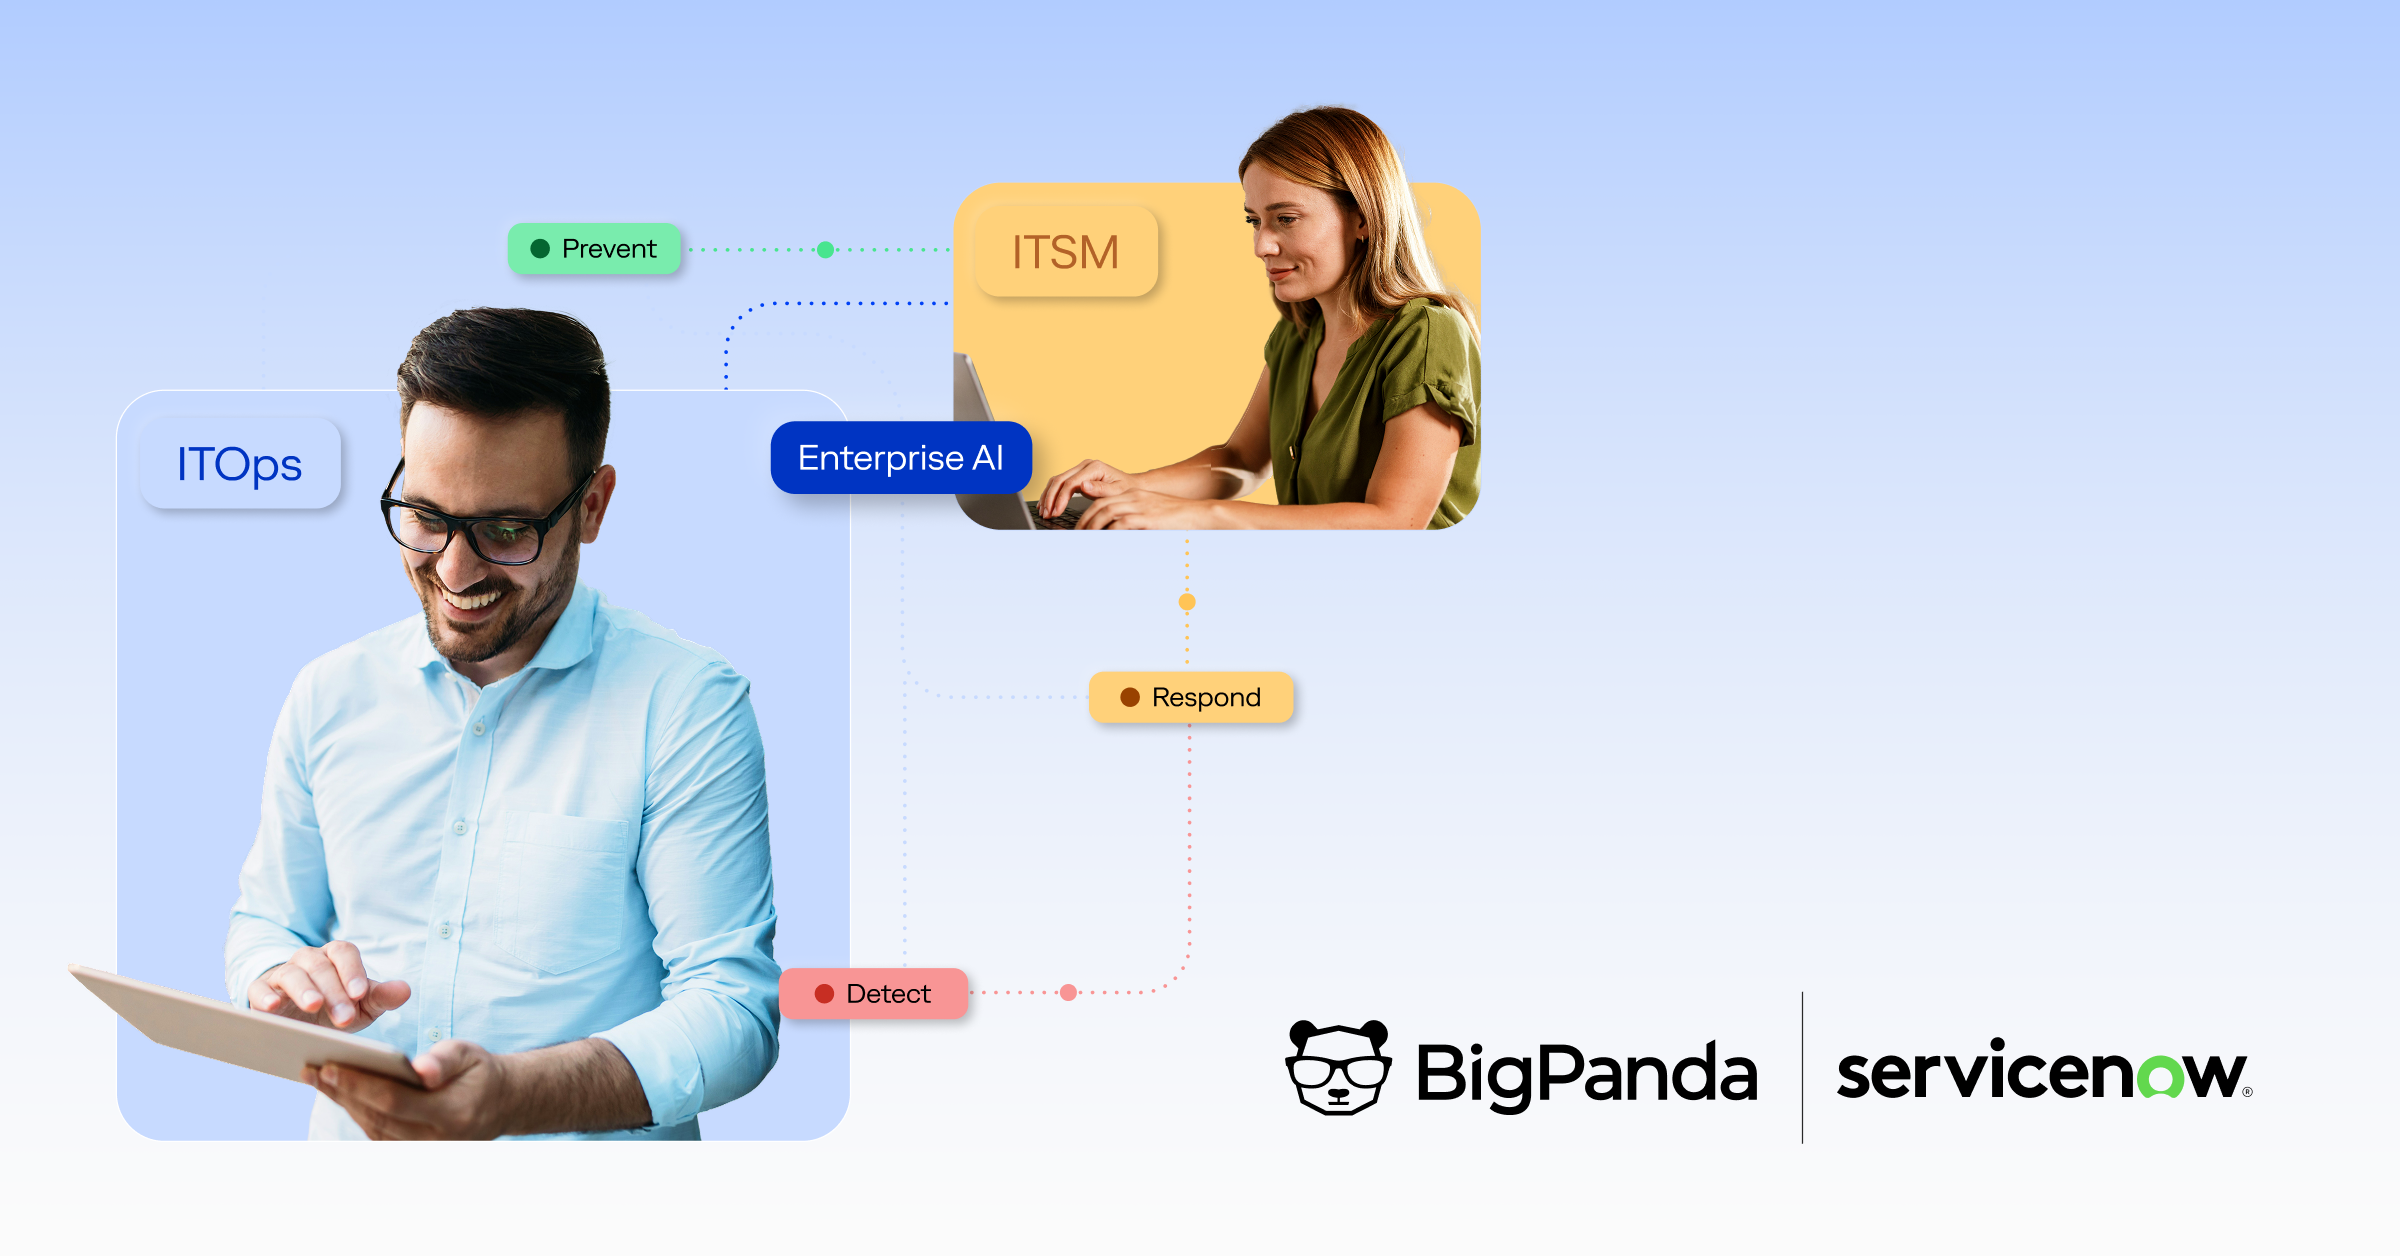


How metrics can make or break IT operations strategy

IT people know that data is paramount, especially in optimizing IT operations. However, figuring out which metrics to collect and how to collect them can be challenging. IT teams have to factor in what IT directors, team managers, and the people overseeing operations want, what they’re concerned about, and what they consider important.
I hosted Keith Cole, the IT operations manager for NTT DATA Services, on our That’s great IT podcast to discuss this and how creating and reporting the right set of metrics can help IT teams better explain their productivity to managers while also revealing ways to improve efficiency.
The right metrics to measure IT’s capabilities
Nearly all ITOps teams should be measuring these two things:
- Ticket resolution rate
- Throughput
The resolution rate will obviously be affected by the number of difficult tickets you’re resolving versus the number of easy ones coming through. Cole said that’s why it’s important to base the resolution rate on the urgency and difficulty of the tickets.
He shared the example of an organization where most tickets fall into the category of “normal.” In that situation, the metric might be that all normal tickets must be resolved within 24 hours. If you wanted to improve tracking, you could assume that 80% of tickets would fall into the normal category.
“If you resolved 80% of your tickets in 24 hours, then obviously your resolution rate is 100%,” Cole said. “So, how close or how consistent can you get to that 100% every week, every day, every month?”
This ties directly into using throughput as a metric because IT teams also need to be able to show that different tickets have different priority for this metric to work. While creating those classifications can require a lot of upfront work, Cole said setting those parameters has to be a priority.
That’s because there’s a difference between saying your IT team handles an average of 400 tickets a month versus explaining what was involved in handling those 400 tickets. Leadership will be much more receptive if an IT team can explain that of those 400 tickets, 300 are normal wear tickets that we see results on in 24 hours. Then, out of the remaining 100, 50 are projects that take a little longer than 24 hours, and the other 50 take a lot longer than 24 hours.
“Being able to paint that picture of what your throughput is, and not just the number of tickets but the value or the size of being able to break down those tickets, [is important],” Cole said.
Then, if someone from senior leadership asks why your department has such a high backlog, you have the data to provide context.
While throughput is sometimes measured at the individual employee level, Cole said he’s always measured it at the organization or department levels. Organizations can get into some unique situations if they try to do it on an employee level. For example, if one person gets most of the more complicated tickets that take longer to resolve, some metrics may make it seem like they aren’t doing as much work. Those are the types of situations that can harm morale.
Other metrics to consider
Cole said looking at the lifecycle of software or applications can also create efficiencies, although it may be more complicated to create metrics around that.
For example, if an organization has 400 servers, there are hidden costs associated with that—specifically, the actual dollar amount out of amortization over time or depreciation over time. So organizations want data to show how much things cost annually.
Is creating timestamp requirements on tickets necessary?
As IT teams and organizations get into the nitty-gritty details of these metrics, they are often tempted to add timestamp requirements to track every action of IT. While that will create a metric that can result in more data, it also might frustrate ITOps team members.
For example, there might be 10 different timestamps on a ticket. Although some of it is operational, asking an operator to track all of their different activities can sometimes create a grind. In the aggregate, organizations might have retention issues as frustration mounts.
Cole said stakeholders need to consider whether timestamps provide any value to the client. Many users do not care about additional timestamps; they just want IT to fix their issue.
“Between the time you resolve and the time you have to close, if someone is saying we want to measure that, then that really has to be centered around, ‘How’s that helping the customer, how’s that helping the client?’” Cole said. “That’s the question you would ask in order to justify… measuring something like that. If it’s not valuable to the customer, then why even do it?”
That doesn’t mean timestamps don’t provide value. They can help IT teams make a better case to an organization’s leaders to show them how much time different types of tickets take. Being able to say, “Now you understand why I can’t close everything, or I can’t resolve everything because the plate is full, the plate is overflowing,” can be very valuable and help track that.
In the end, if a business is imposing arbitrary timestamps without strong justification, they are creating another pain point for operators. But, if you’re an operator who’s able to defend their activity and their time by creating timestamps, then it becomes a beneficial activity. It’s all about creating a balance.
How should you collect the metrics?
Other than timestamps, where does data come from for a metric like resolution rate? How is it collected and then shared with an organization’s leadership? It could come from your ticketing system, or you might be pulling datasets that can regularly produce a report or a graphic for the organization you have a service-level agreement (SLA) with.
Ideally, an organization should have a ticketing system that can produce those reports. For example, an organization could have a system configured so that when a ticket hits, the clock starts, and as soon as it’s closed, the clock ends. And the time period between the start and end time is calculated and reported.
Building on that idea—where the timer starts and the timer ends—there are sub-values that also can be helpful.
For example, in terms of key performance indicators (KPIs), from a customer service perspective, that’s often best measured by time to assign. Organizations want to show that every ticket is being looked at immediately by staff to demonstrate to the user that their ticket is not sitting in limbo.
“From a customer-service perspective… that’s one of the things that I preach is to leave no tickets unassigned. Even if they’re sitting in your queue, at least from a customer’s perspective, they know that they can go to that person and say, ‘Hey, I need you to prioritize my ticket,’ because without that, the customer doesn’t know where to go. And then it comes to the manager,” Cole explained.
BigPanda has customers with operating models that run the gamut, and we see SLAs that look at metrics for each stage of the ticket. For example, some organizations require that tickets have to be acknowledged within five minutes. Acknowledgment might just be an assignment, though.
Some SLAs want metrics to measure resolution, but their process might not allow for that to be measured based on ticket closure. For example, the company might have a process where the issue is resolved and the operator puts a resolution in, but in the case of severity 1 or P1 tickets, they’re not closed until the post-mortem is complete. The result is that the total ticket duration might be three days, but the severity of the incident might have been 146 minutes.
Use metrics to optimize IT operations
Obviously, the end goal of most metrics is to optimize IT operations—and on the flip side of that, optimizing ITOps can result in better metrics.
Cole shared an example where an IT team takes work that a Level 3 (L3) engineer has done, packaging it up, and passing it to the helpdesk so that they can do the work without getting an L3 involved, which can free up a lot of time for the ITOps team and improve overall metrics.
Another option is having the IT teams provide users with tools to help them handle tasks on their own. A good example of this is creating a system allowing users to update their passwords and meet security standards without any IT involvement.
“That turns 30 tickets or 100 tickets a month into zero tickets. And that’s a success story,” Cole said. “If [those] 30 tickets took maybe six hours of your time, now you have six hours free dedicated to working on something else.”
And if you have a blended-rate cost per minute of an operator, you can quantify how much savings it represents.
How often should you look at these metrics?
So, how often should you look at these metrics? Cole says it varies, but monthly or yearly are usually good time spans. However, you have to look at monthly and yearly metrics through different lenses.
“For monthly, you can say you’re looking back on the month and say, ‘Okay, these are the tickets that we handled in the past month.’ One example, every December, where I work for now, people retire [at the] end of the year. So we have an influx of tickets every year. So at the end of every year [everyone needs a new laptop]. So that’s something you can look at and analyze and say, ‘Okay, I know that this happens every year. Is there an opportunity to address this, or is there an opportunity to improve on responding to this?’”
For example, by using predictive analysis to say, “I know this is going to happen; is there an opportunity to do that?”
But then the annual evaluation looks at month-to-month over time and dissects and breaks down the data. Cole explained that if you typically have 40 tickets every month, but there is a pocket of time where there’s a spike or a lull, what adjustments can be made to address those fluctuations?
“You have to look at it from multiple angles because the business continues to run, and you want to be able to look back in order to predict the future,” Cole said. “So you have to look at different ways in order to be able to do that.”
One of the things to look at monthly is whether there was an improvement. If it’s February, you probably want to look at February from the previous year to take into account any cyclical issues.
Involve all stakeholders in setting metrics
Now that we’ve looked at which metrics work best and why and how to measure them, the next step is making sure that your ITOps team is able to communicate that information to leadership. Most of these metrics are included in SLAs, and Cole said you ideally want to have all stakeholders involved in crafting those decisions—as opposed to a list of requests from leadership.
While SLAs should be set first and foremost by the requirements of the organization, Cole said the IT department should have the opportunity to provide input as well because the organization needs to understand the associated cost.
“The business has to understand what they’re exactly asking for,” Cole said. “You want the best service, but are you willing to pay for them?”
And as an ITOps manager, it’s important to be able to explain to an organization what’s realistic. Then, if there’s a gap between a request and what’s actually possible, the ITOps manager can explain to the organization what they’d need to meet those requirements, Cole said.
After all, if you’ve got requirements coming from your leaders that are completely unattainable, that doesn’t do any good for anybody. These things have to be rooted in reality.
For more insights into ITOps, AIOps, and tech in general, check out our podcast, That’s great IT. We explore timely topics in the tech industry in a fun way and host some incredible speakers, so make sure to follow our podcast.