


1
Why measure incident response metrics and KPIs?
IT incident management focuses on quickly identifying and resolving IT issues to restore normal service operations. Tracking key performance indicators (KPIs) of incident response is vital in minimizing service disruptions affecting customers and users.
With so much data and many things to track, it’s difficult to identify which metrics and KPIs are right to track. What are the right incident response metrics to use to drive meaningful improvements?
Incident response is the handling and escalation of IT problems as they occur to meet defined service levels. Incident response KPIs provide advanced insights into how your enterprise addresses incidents, including outage duration, team performance, and other factors. These incidents can include hardware, software, and quality issues.
Crucial measurements include incident duration, number of incidents, and mean time to resolution (MTTR). These KPIs help you assess the impact on end users, highlighting the importance of quick recovery to avoid potential business losses from system downtimes. Incident response metrics — such as mean time to acknowledge (MTTA) and mean time to detect (MTTD) — are essential to evaluating the efficiency and speed of your team’s initial response.
Although often used interchangeably, KPIs and metrics have distinct meanings:
- KPIs align with critical business objectives
- Metrics are a broader measure of performance
Regardless, closely monitoring the measurable aspects of performance allows you to gauge progress toward incident management and response objectives.
2
Benefits of tracking incident response metrics
Tracking metrics and KPIs helps IT service team managers improve operations by highlighting strengths and challenges within the IT infrastructure.
Incident response KPIs can highlight weaknesses in the incident resolution process. Consider an ITOps team that is concerned about the duration of service disruptions. The manager discovers that although the team diagnoses simple issues quickly, sorting through and escalating alerts slows them down. Assigning to the correct L2 and L3 responders also takes too long. The duration of service disruptions shows the manager that part of the incident response process needs attention.
Analyzing alerts can reveal correlations between issues that involve the same factors, such as configuration, priority, user group, dependencies, tech assigned, service involved, or location. From there, you look at these holistically and design changes.
KPIs define performance benchmarks and specify concrete goals for improvement. Better productivity leads to higher user satisfaction, increases system reliability, and aids in achieving business objectives. Metrics may also highlight incidents related to hardware that needs replacement or has configuration issues.
3
Different metrics and KPIs
Essential incident response KPIs
- Incident severity levels: This helps you categorize incidents by severity (e.g., critical, high, medium, low) and effectively prioritize responses and resource allocation.
- Response time: The time taken to respond to an incident from the moment it’s reported highlights the efficiency of the initial response process.
- Resolution rate: The percentage of incidents resolved within a specified time frame indicates the efficiency and effectiveness of the incident resolution process.
- Escalation rate: The percentage of incidents escalated to higher-level support or management indicates the complexity or difficulty in resolving specific incidents.
- Customer satisfaction score (CSAT): Measure satisfaction with the incident management process using end-user surveys and feedback forms after an incident.
- Reopen rate: The percentage of incidents reopened after being marked as resolved. A high reopen rate can indicate issues with the resolution quality or incomplete fixes.
- Cost per incident: The average cost associated with issue resolution, including labor, resources, and other expenses, helps establish the financial impact of incidents.
Top incident KPIs
- Compression rate: This measures the correlation of similar alerts to events or incidents. Specifically, the compression rate is the percentage of alerts grouped into incidents. High compression rates generally translate to improved efficiency by automating the initial review of alerts.
- Impact duration: The time between issue onset and incident resolution represents the effect on customer and user experience. It’s a crucial service availability measurement, sometimes quantified in “impact minutes.”
- Incident duration: The time between when the service team creates a ticket and when it’s resolved. Duration reflects the utilization of service resources and can be a crucial indicator in service-level agreements (SLAs).
- Incidents resolved on first contact: The percentage of incidents resolved with the initial service-desk contact or when a support team member first acts on the problem.
- Incident volume: How many incidents occur within a specific timeframe, such as a week, month, or year.
- Uptime: The percentage of time that an application or system is fully functioning and available to users.
Mean-time metrics
Mean time to X (MTTx) measures the average time it takes to perform a specific action or set of tasks. MTTx metrics calculate the performance of your incident management team.
- MTTA: The mean time to assign is the average time it takes the ITOps team to assign an incident after receiving the alert. BigPanda calculates MTTA as:
(First assigned time – Start time)/60. - MTTD: Mean time to detect (or discover) is time between the onset of an issue and how when a team becomes aware of it.
- MTTE: Mean time to engage measures how long it takes the ITOps team to act on an incident after it has been assigned. The calculation for MTTE is:
(First activity time – Start time)/60. - MTTF: Mean time to fix represents the average time elapsed between engagement and resolution. In BigPanda, MTTF is automatically calculated from when someone performs an action on the incident to its resolution. The calculation for MTTF is:
MTTR – MTTE – MTTA. - MTTR: Mean time to resolution is the average time required to return to service. MTTR looks at the repair of alert symptoms rather than the complete resolution of the incident. In BigPanda, MTTR is calculated from the receipt of the first event to the resolution of the last alert. The calculation for MTTR is:
(End time – Start time)/60.
4
What do SLA, SLO, and SLI mean in incident response?
Service levels are baseline expectations agreed to by an organization and its customer or between the IT team and its users. The components of these expectations are the following:
- SLA: Service-level agreements center on promises of certain performance thresholds, or SLOs. An SLA defines penalties or consequences for not delivering results, such as a cost reduction for the customer. The user might also have responsibilities, such as reporting issues promptly. ITOps teams may monitor the number of incidents and responses that breach SLAs.
- SLO: Part of SLAs, service-level objectives are the metrics for determining if the team met the SLA. Ideally, SLOs should be straightforward to track. Typical measures are uptime (the average percentage of time an application or service is operational), latency, and throughput. Additional measures like MTTR are critical for the incident response metrics.
- SLI: A service-level indicator measures compliance with SLOs. If your SLO defines 99.95% uptime and you achieved 99.995%, your SLI is 100%. To comply, the SLI has to meet or exceed the standards set in the SLA. In incident response, SLIs monitor performance indicators, such as response times and resolution rates, ensuring the response team meets the required standards for effective incident management.
5
Metric and KPI tracking
Key metrics dashboard
A KPI dashboard for incident management showcases critical data in one view. The dashboard should be continuously updated to provide a real-time status of incident management.
Common KPIs include the number of open incidents, average age of open incidents, average incident duration, average impact duration, MTTD, MTTA, and MTTR.
If you’re focused on improving a specific part of the team’s workflow, include a KPI that reflects performance changes in this process.
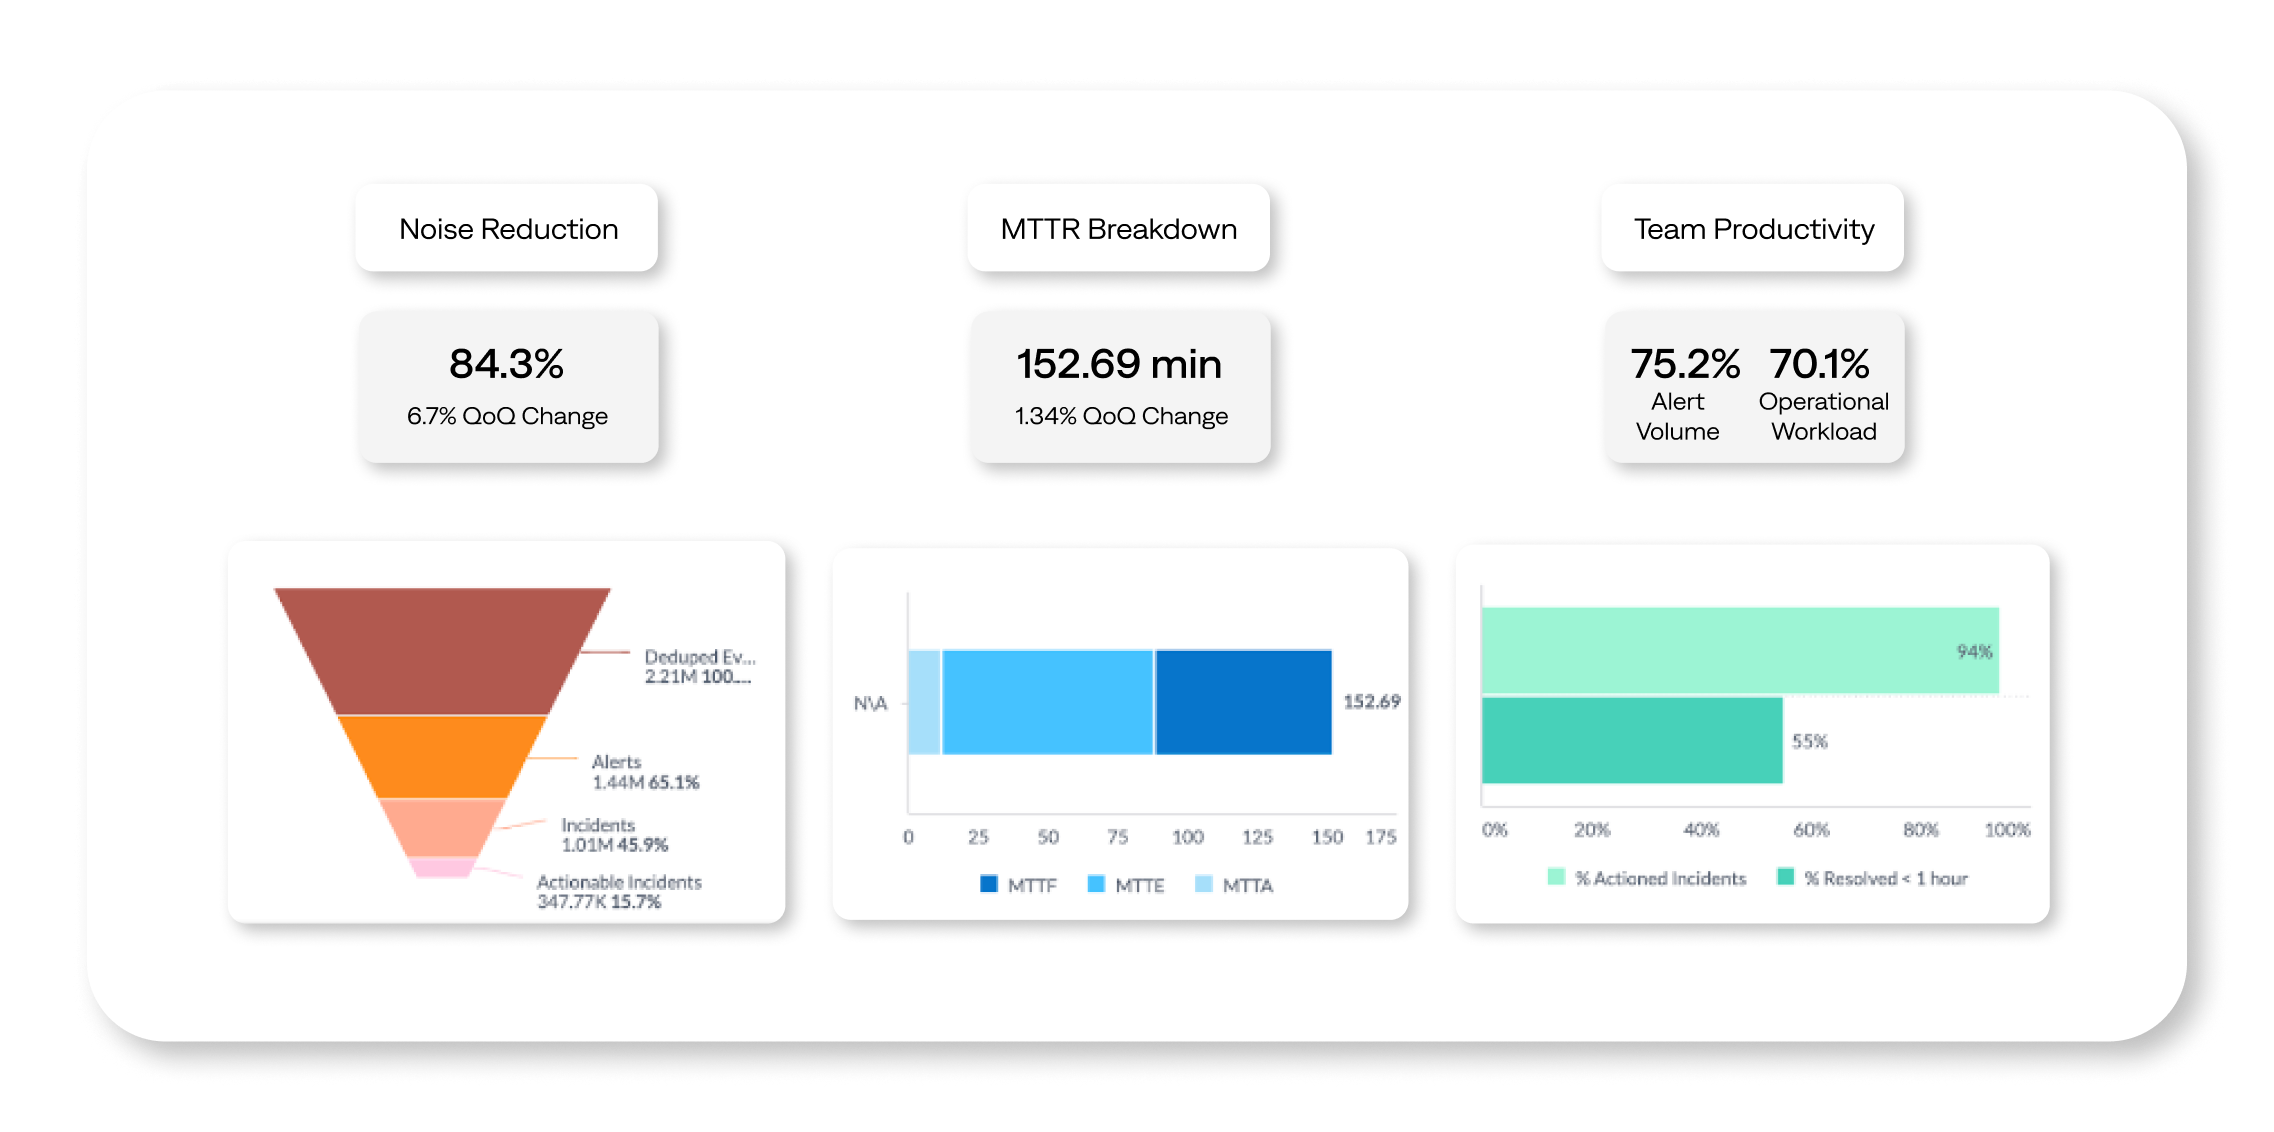
A dashboard needs reliable, real-time data to be valuable. Your dashboard can provide a live view of incoming incidents, their origin, status, and how quickly the team closes tickets. BigPanda Unified Analytics provides interactive dashboards, like the Executive Summary dashboard, displays pre-defined KPIs to measure and track performance against targets.
Use the insights to streamline data-driven improvements in incident management and business outcomes within complex IT operations. You can also use the information to create new use cases that showcase the tangible business benefits of improving ITOps processes.
6
Improve incident response metrics and KPIs with BigPanda
Every ITOps, SRE, and DevOps team strives to improve its KPIs. However, it can be challenging to identify which changes will have the greatest benefit. These are some of the best ways to improve incident management performance.
Reduce the number of incidents
Noise often overwhelms service teams, impacting all incident management and response KPIs. High incident volume stresses resources, making it hard for service engineers to respond quickly, diagnose problems, and resolve them. Reducing incident volume starts with optimizing alert management, implementing rule-based silencing to filter out unnecessary alerts stemming from routine activities, and adjusting alert parameters to reduce non-actionable notifications. Additionally, correlating alerts can group related notifications, preventing teams from addressing duplicate incidents.
Improve incident response time
To speed up incident response and enhance incident management, you need to automate the resolution of minor issues, ensure clear escalation protocols, and use AIOps to do proactive anomaly detection and alert correlation. By doing so, teams can prioritize significant incidents, reduce duplicates, and ensure efficient response mechanisms.
Strengthen diagnostic capability
Effective incident management addresses immediate incidents and emphasizes in-depth problem management to prevent future issues. Incorporating post-incident reviews, codifying knowledge in runbooks, and leveraging AIOps can streamline responses, aid in root-cause analysis, and reduce MTTR.
Embrace continuous improvement
Continuously iterate and evaluate processes using key performance indicators, like MTTR, to measure incident-response improvement. Gather comprehensive data on each incident to identify opportunities for improvement and to better understand the nature of the incidents.
7
Challenges and limitations of incident response metrics
Although it’s crucial to monitor incident management KPIs, it’s important to understand the limitations. Excessive data can cloud vital insights. KPIs reveal outcomes, not causes. The complexity of diagnosing problems requires a deeper analytical approach and ML tools.
MTTx metrics, which measure ITOps efficiency, can be misleading. It’s important to analyze information in context. The same MTTx can signify different business impacts depending on circumstances. Imagine if an organization has no issues for weeks, and then experiences a major incident that takes a day to resolve, resulting in a 10-hour MTTR. In contrast, a typical enterprise with frequent minor incidents might have a 2-hour MTTR. Yet, the company with fewer issues may manage its IT better.
8
How AI and ML are changing incident management and response
AI and ML are reshaping and automating formerly manual processes in incident management and response. AIOps platforms like BigPanda uses AI to:
- Filter alerts to identify important issues
- Connect related alerts to minimize redundant work
- Automate aspects of ticketing, issue categorization, and escalation
- Identify the right team to address the issue
- Correlate alerts and system changes to identify the root cause
- Visualize topology and timelines to expedite resolution
BigPanda AIOps uses generative AI (GenAI) to enhance IT incident response by sifting through massive operational datasets. That’s where BigPanda offers deeper, contextual perspectives. This in-depth visibility not only streamlines incident response efforts but drives continuous improvement in operational strategies.
9
More efficient incident management and response
Transform your incident response capabilities with the power of the BigPanda platform. BigPanda components help swiftly and intelligently resolve IT incidents:
- Real-time incident detection: BigPanda quickly spots problems as they happen. This proactive approach empowers you to address problems promptly, preventing potential business-disrupting outages.
- Automated triage: Assess alerts swiftly and accurately with a wealth of contextual information. The context-rich BigPanda environment enables teams to make informed decisions, significantly reducing incident response times.
- Advanced topology modeling: BigPanda goes beyond surface-level analysis to build detailed models of your setup, making it easier to find and fix what’s causing issues and prevent them in the future.
BigPanda provides systemwide visibility, conducts context-rich triage, and automates root-cause analysis to reduce MTTR. Learn more about how BigPanda can transform your incident management and response to improve service availability.