


A data-driven approach to streamline incident response
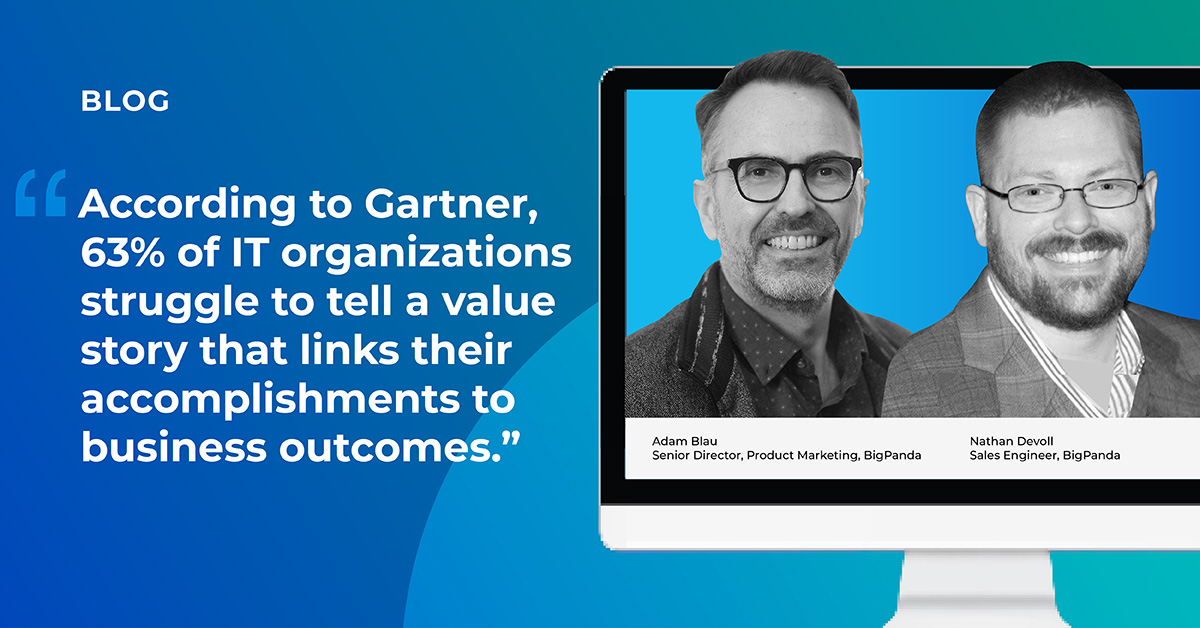
According to Gartner, Inc., “63% of IT organizations struggle to tell a value story that links their accomplishments to business outcomes”.1
BigPanda built Unified Analytics to help ITOps teams easily investigate and capture new insights from their data. Our recently enhanced Unified Analytics solution provides IT organizations the ability to drive organization improvements with highly interactive ITOps dashboards from their complex ITOps data. We also launched new and improved out-of-the-box (OOTB) ITOps dashboards, all designed with our customers’ input, to help them articulate the business impact from the improvements ITOps makes using AIOps. On a recent webinar, BigPanda’s Adam Blau, senior director of product marketing, and Nathan Devoll, sales engineer, presented the revamped offering to BigPanda partners. Read on to learn more.
The road to measuring ITOps business value
In order to be able to evangelize IT operations’ success within the lens of business value, Adam Blau shared four specific challenges customers must overcome:
1. Siloed IT operations data. Grabbing the data is just the first step. Until data is ingested and normalized into a consistent format, Adam says, it remains siloed—which is a “headache that can make a lot of work.”
2. Lack of self-service. Letting people quickly access the right data without system-hopping or relying on others is also crucial. Adam said people must be able to “drill into data, filter it and ask questions of it at a self-service level for before-and-after analytics to truly be possible.”
3. Unknown key performance indicators (KPIs). This one is entirely company- and division-dependent. “There’s a lot of time spent trying to understand which KPIs to measure and which KPIs belong on which dashboards. Then, you have to figure out how to calculate them and show them to other teams,” he said.
4. How to show business value. Once a company has achieved the first three steps, the final step to before-and-after analytics comes from understanding how companies show improvements across different workflows. What role do different teams play, and how do those teams quantify improvement?
We understand how challenging overcoming each of these hurdles can be. So we spoke to our customers and revamped our Unified Analytics solution to address these challenges. For the first time, customers can now create new and interactive ITOps dashboards to accommodate their complex data. We’ve revamped how the solution extracts, transforms and loads the information organizations use, giving them for the first time the ability to connect alerts to operator actions.
BigPanda’s Unified Analytics creates a route to measuring ITOps business outcomes through:
- Unified ITOps data. Gain end-to-end visibility from alert to operator action.
- Self-service analytics. Create and own ITOps dashboards and KPIs.
- Out-of-the-box ITOps KPIs. Identify processes and align ITOps improvements.
- Business impact. Translate ITOps metrics with new value use cases.
These improvements help organizations understand the precise value their ITOps teams and solutions provide at every level.
Adam Blau provides detail on each of the four components of the solution and shares specific customers’ insights from Lumen Technologies, which you can hear in detail when you watch the webinar .
New interactive ITOps dashboards
Self-service dashboard creation and viewing
BigPanda’s Sales Engineer Nathan Devoll shared a deep dive of the improved Unified Analytics solution.
Enhancements to the solution enable ITOps decision makers to take control over the way their dashboards look and the data they ultimately display. Users are free to build dashboards completely from scratch, with both designer and read-only roles available. For those who prefer preassembled dashboards, they are available too.
Each OOTB dashboard was built using our knowledge of the information customers tend to find most useful, saving customers valuable time. Users can add filters to each dashboard and KPI that sorts and displays specific information across all ITOps event, change and topology data ingested and actioned data within BigPanda.
We built our preassembled dashboards based on our in-depth knowledge of the information different users want to consume, with an emphasis on different. Nathan’s overview of the Executive Summary dashboard, one of multiple available to users, reflects this idea. Designed for senior level executives, it provides an easily digestible view of how ITOps is trending—-including all incident management processes—with higher-level information on noise reduction, mean time to resolve (MTTR) and team productivity.
- Monitoring sources: The dashboard gives tool administrators “a clear understanding of where different types of data originate from and how useful it is.”
- Alert analysis: Built for administrators or operations teams’ monitoring tools, this dashboard clues stakeholders into patterns in alert floods and enables them to spot low thresholds that may need to be optimized and highlight problematic hosts or applications.
- Enrichment: Customers use this dashboard “as a means to understand where there are gaps within some of their [configuration management databases] CMDBs or [configuration item] CI-capturing tools,” Nathan said, “whether it’s spreadsheets or not.” The dashboard measures the effectiveness of your enrichment data and “bubble-up top offenders with no enrichment.”
These dashboards can be used as is or modified to the individual team’s needs. And while they all are developed with different roles and needs in mind, the information—pulled from numerous sources across the ITOps environment—can be molded, safeguarded against potential issues (such as statistical outliers) and displayed as needed based on the viewer’s individual role. Other dashboards discussed include Raw Data, ITSM Tools, MTTx Breakdown and Team Efficiency.
Learn more about Unified Analytics today
To learn more about the Unified Analytics solution, click here. For more information on becoming a BigPanda partner, reach out to me directly: aivankovic@bigpanda.io
————————————————–
Gartner does not endorse any vendor, product or service depicted in our research publications, and does not advise technology users to select only those vendors with the highest ratings. Gartner research publications consist of the opinions of Gartner’s research organization and should not be construed as statements of fact. Gartner disclaims all warranties, expressed or implied, with respect to this research, including any warranties of merchantability or fitness for a particular purpose.
Sources: