


Autodesk uses BigPanda Event Enrichment Engine to accelerate ITOps
Today’s incident pipelines are noisy. The average company uses at least 15 different monitoring tools. These tools create thousands of alerts each day. This can overwhelm and burden their IT operations. But it’s not just their number that’s an issue. These alerts have a lot of technical details, but they miss important context. They do not include information like priority, affected apps or locations, or which team should investigate. This makes it hard to connect them into meaningful incidents. It is also tough to find their root cause, understand next steps, or automate different incident management tasks.
The result? Long outages can cause a lot of problems for admins, engineers, users, and customers. These issues can last for a long time. To tackle this challenge, IT Ops teams must clean, prepare, and enhance their alert data. They need to add useful context from different areas and systems. Plus, they have to do all of this on a large scale.
The “at scale” part is what makes this tricky. If you have just one or two monitoring tools or IT/Dev teams, it may not seem hard to set up those tools. You can add extra details directly to the alerts as they are made. As you add new tools, build new applications, or bring in more teams, managing these changes can become overwhelming. A single AIOps solution is best for modern businesses. It collects all alert data and centralizes enrichment. This helps to intelligently link alerts into incidents across all functional areas.
I recently hosted a webinar with Sid Roy, VP Operations and Client Support at Scicom. He shared great insights on data acquisition and preparation. I also had Samy Senthivel, Sr. Manager of Engineering-Observability at Autodesk join us. He talked about their centralized event enrichment process using BigPanda. You can watch the on-demand webinar here.
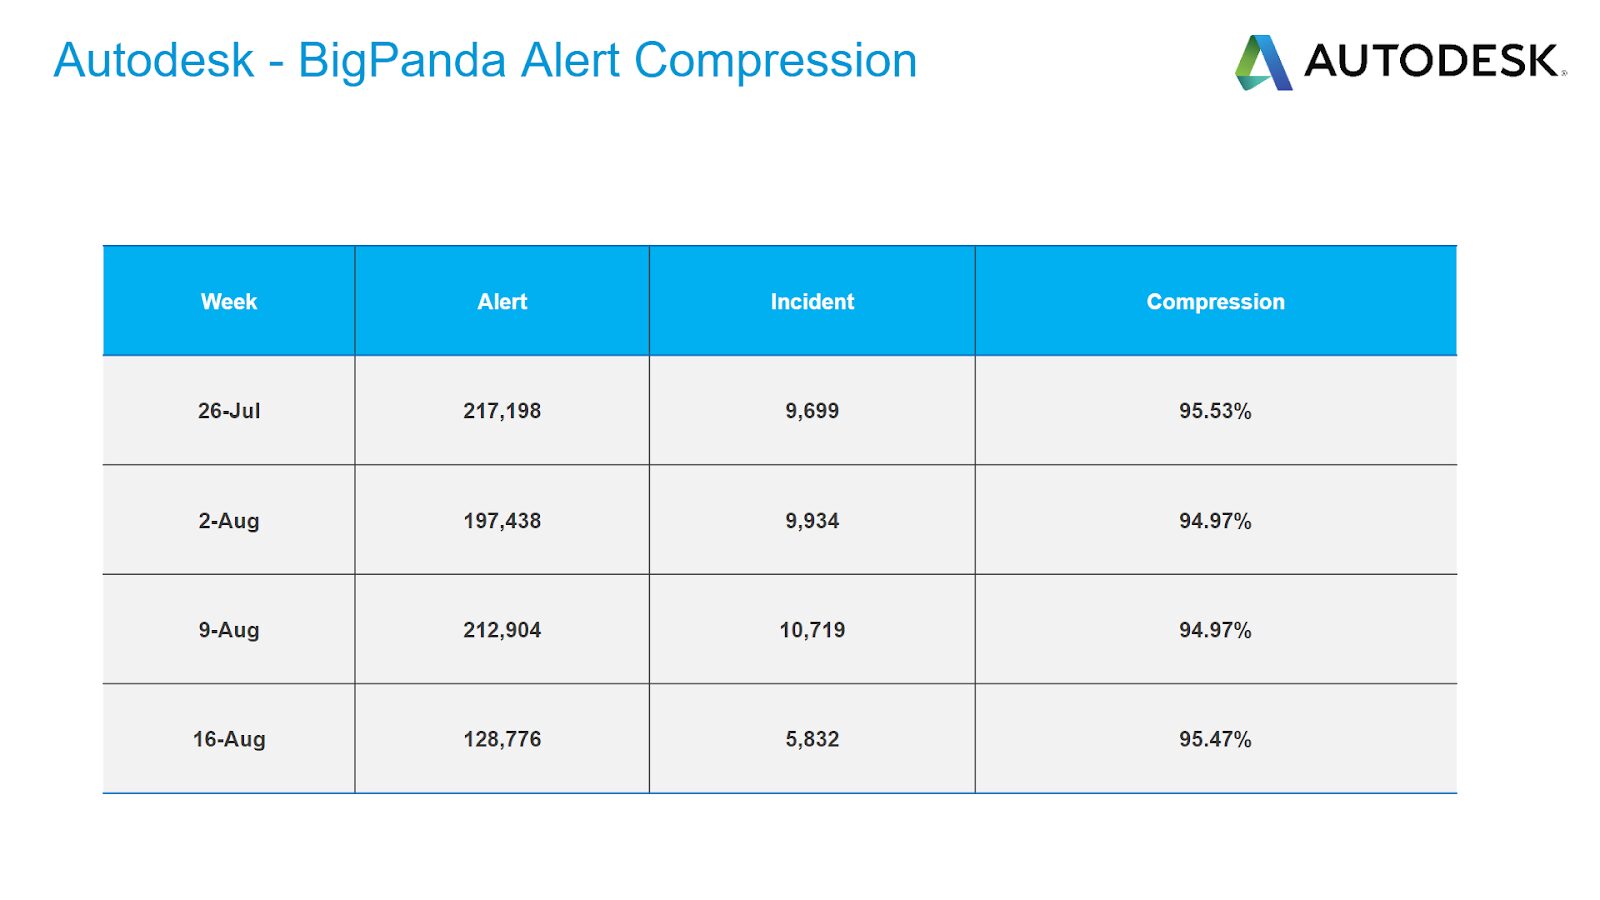
In this blog, we’ll focus on the event enrichment phase. We’ll see how Autodesk uses it to cut their IT noise by 95% and speed up their IT operations.
Autodesk’s incident management lifecycle
Autodesk’s incident management lifecycle has five stages. First, an issue is triggered. Next, monitoring tools create an event. Then, data pipelines handle event ingestion. After that, AIOps enrich, correlate, and analyze the event. Finally, action is taken for incident response and remediation.
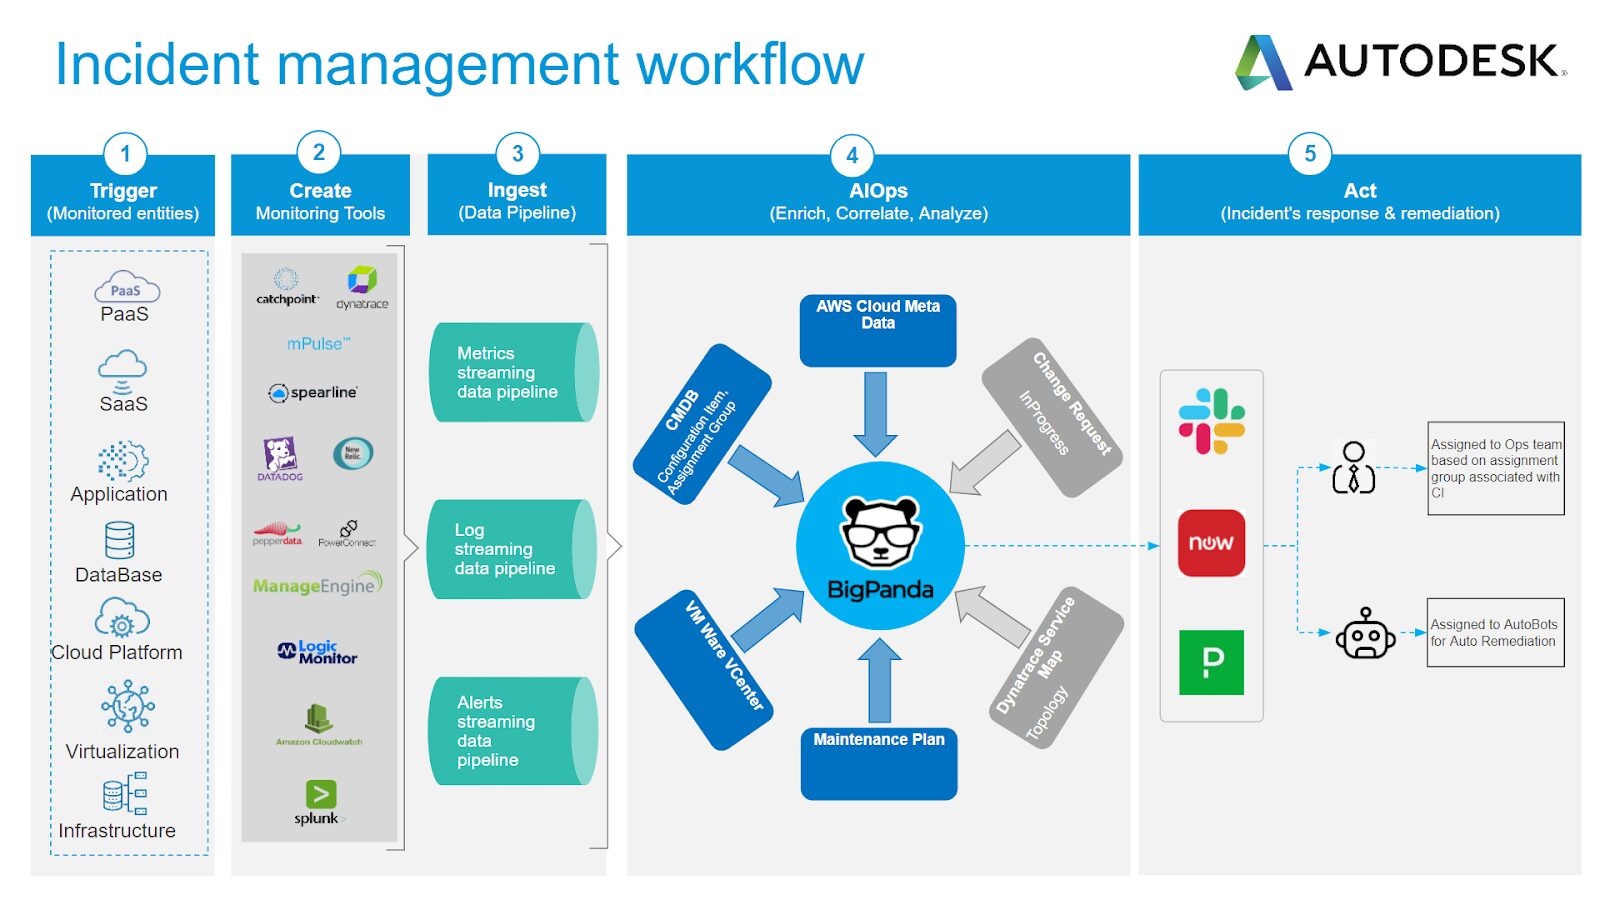
The first steps involve creating monitoring events and alerts. This happens when we find issues in the collected logs and metrics. As Samy states, Autodesk has 25 different tools that monitor their applications and infrastructure. These tools create data streams, but do not analyze or correlate them. The Autodesk IT Ops teams often handle a lot of alerts, metrics, and logs. These are sent to three dedicated pipelines.
This is where BigPanda comes in. BigPanda takes in alerts and adds data from Autodesk’s ServiceNow CMDB, Maintenance Plans, and Change Requests. It also includes information from their VMWare VCenter, AWS Cloud metadata, and Dynatrace Service Maps. BigPanda uses its Open Box Machine Learning to connect these detailed alerts to important incidents. Then, it sends them to operators for triage, fixing, and resolution.
How enrichment helps accelerate Autodesk’s IT operations
Autodesk utilizes BigPanda’s robust enrichment engine in many ways to enhance correlation and assist in root cause analysis.
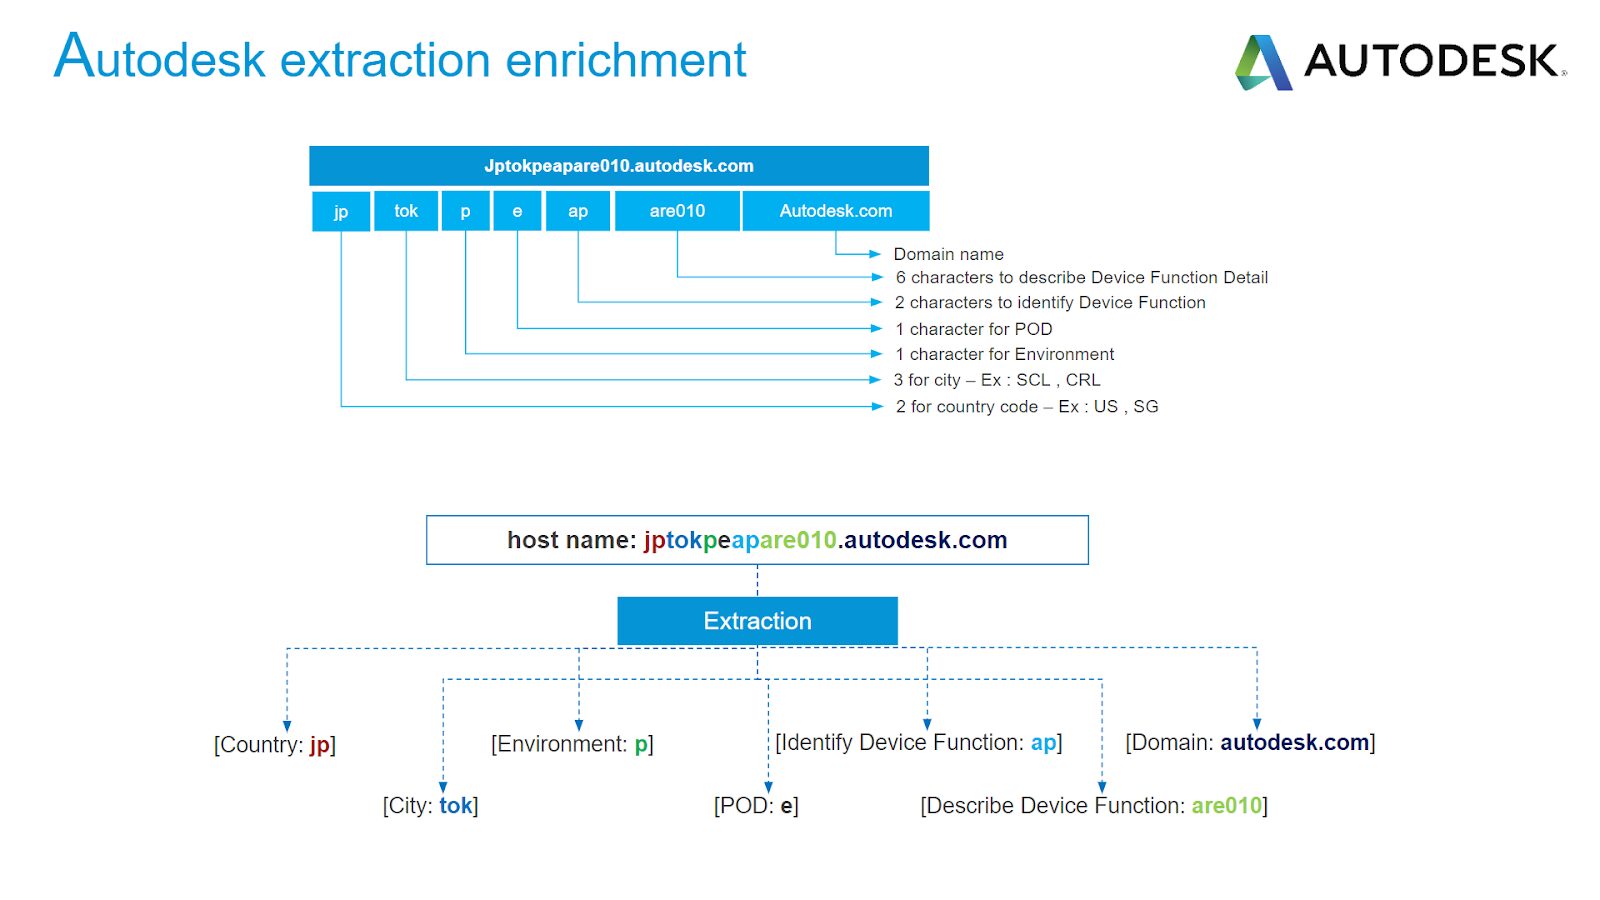
Extraction:
Autodesk uses its host naming convention to extract and create enrichment tags. These tags give details about the alert device, its domain, function, location, and more. This gives a lot of information for linking alerts and understanding their context. For example, you can connect them using a common city tag value.
Mapping:
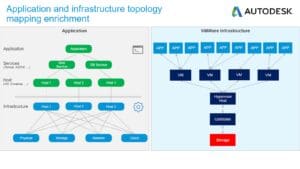
Autodesk applications and topology maps are taken in by BigPanda. They help improve alerts through dependency mapping. This mapping goes into enrichment tables. These tables are CSV files that show which tag to query and the resulting value. You can create multiple maps within one environment. This provides alerts with relevant topology context for better correlation. In the example below on the right, all alerting apps are linked to one VMWare storage that failed. This means their thousands of alerts are combined into one single incident. The root cause of the problem is then easy to find.
Composition:
Composition enrichment lets you combine different tag values to make a new tag value. For example, you can create a runbook URL by merging a wiki base URL with the cluster type tag and the check tag. Autodesk uses the composition feature to find the team responsible for the alert. It does this by adding a CI type tag to the source tag. This allows the triggering of an automated notification through PagerDuty, and a relevant ticket opened in ServiceNow.
These enrichment examples and others help Autodesk achieve amazing correlation and IT noise reduction of 95%!
You can see from the examples above. BigPanda’s Event Enrichment Engine helps you improve your skills over time. Start small, slowly adding data sources and enrichment methods to your alerts. As your correlations improve, your root cause analysis will also get better. You will see these improvements in our Unified Analytics reports. This improvement will help you significantly reduce your MTTR and enhance your IT operations overall. To learn more visit our Event Enrichment Engine page on our website.