Alerts
An alert is the combined lifecycle of a single system issue.
Monitoring and observability tools generate events when potential problems are detected in the infrastructure. Over time, status updates and repeat events may occur due to the same system issue.
In BigPanda, raw event data is merged into a singular alert so that teams can visualize the lifecycle of a detected issue over time. BigPanda correlates related alerts into incidents for visibility into high-level, actionable problems.
This section reviews the annual and daily alert volume and information about alert enrichment and correlation patterns.
Key alert highlights:
“Before BigPanda, we had times when multiple incidents would trigger alerts from three or four different monitoring and observability tools. With all that noise, we didn’t have visibility into alert impact, and could not quickly identify the root cause to know where to focus our triage efforts. With BigPanda, our IT noise is not only reduced, but we can identify the root cause in real time—who the responsible team is, who owns the alerting service, etc.—which is significantly reducing our MTTR.”
–Staff Software Systems Engineer, Manufacturing Enterprise
Alert volume
This section reviews the annual and daily alert volume for the organizations included in this report.
Annual alert volume
BigPanda generated over 587 million alerts in 2024. After filtering out the five event outliers, the total alert count was over 493 million, and the median annual alert volume was 803,406.
- Low and low-medium alert volume: Over two-thirds (69%) of organizations generated fewer than 2 million alerts per year.
- Medium and medium-high alert volume: Nearly a quarter (22%) generated at least 2 million but fewer than 10 million alerts per year.
- High and very high alert volume: Only 8% generated more than 10 million alerts per year.
of organizations generated 2M+ alerts per year in BigPanda
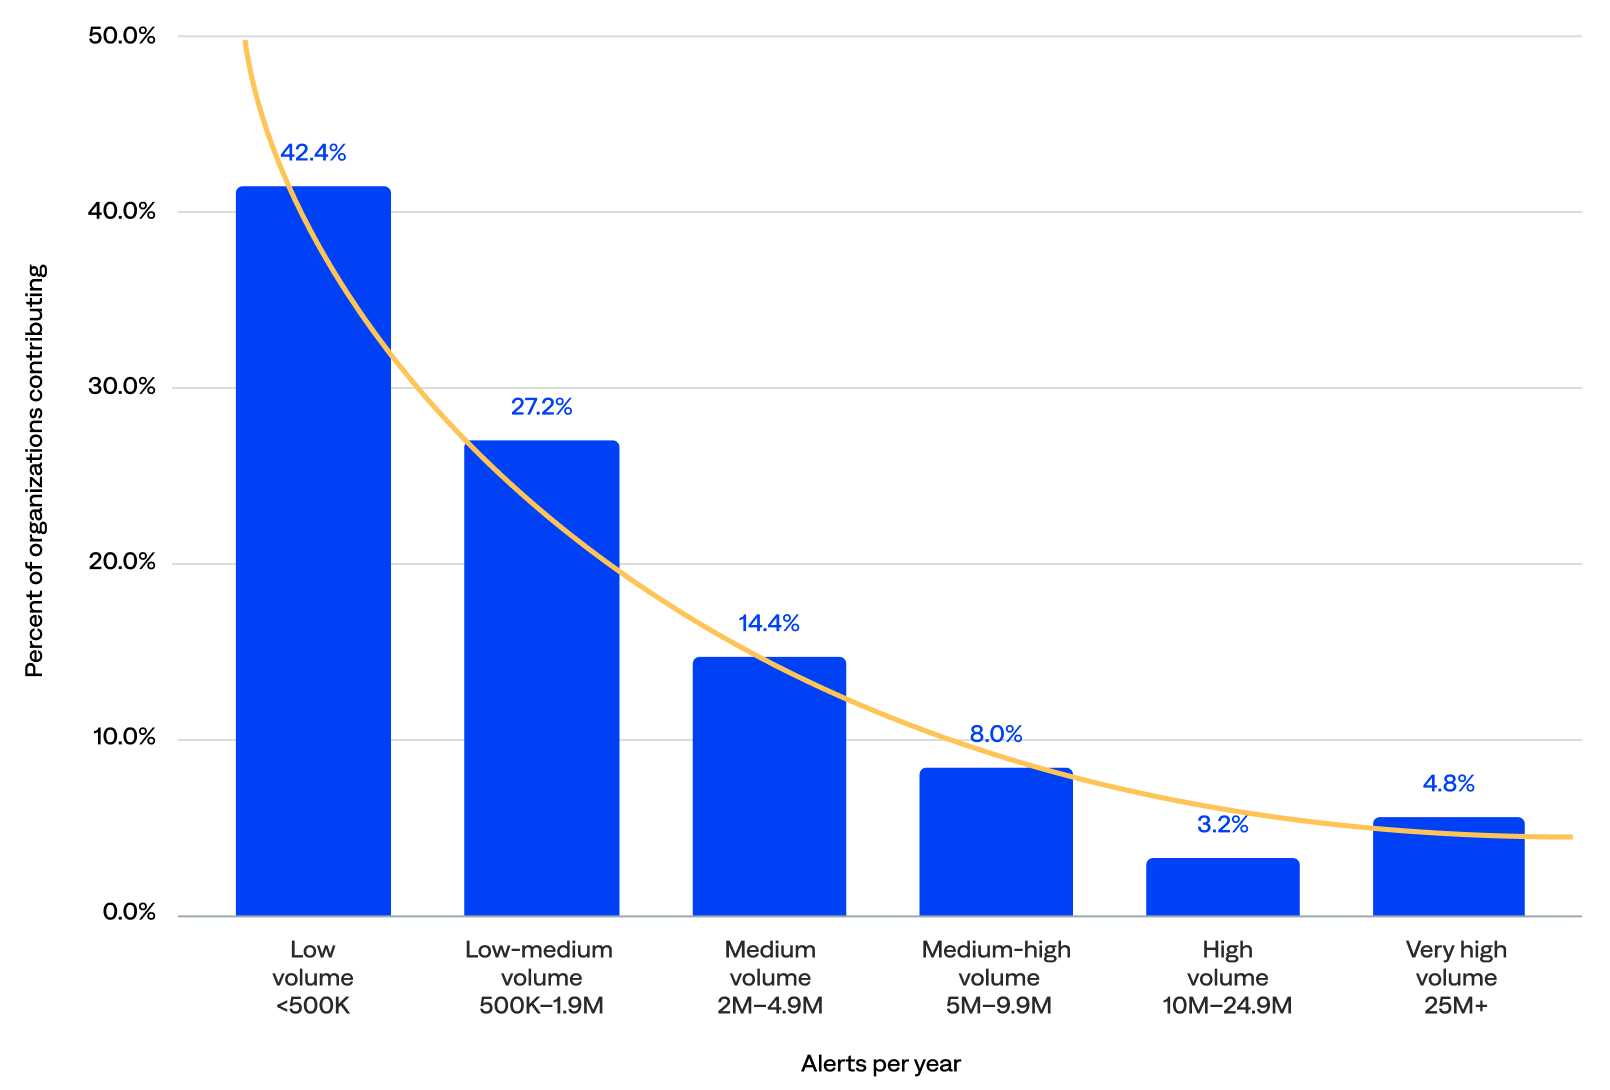
Annual alert volume (n=125)
Daily alert volume
The median daily alert volume was 2,350.
- Low and low-medium alert volume: Nearly half (46%) of organizations experienced fewer than 2,000 alerts per day, including 22% with fewer than 500.
- Medium and medium-high alert volume: About a third (34%) experienced at least 2,000 but fewer than 10,000 alerts per day.
- High and very high alert volume: One in five (20%) experienced 10,000 or more alerts per day, including 9% wi
of organizations generated 2K+ alerts per day in BigPanda
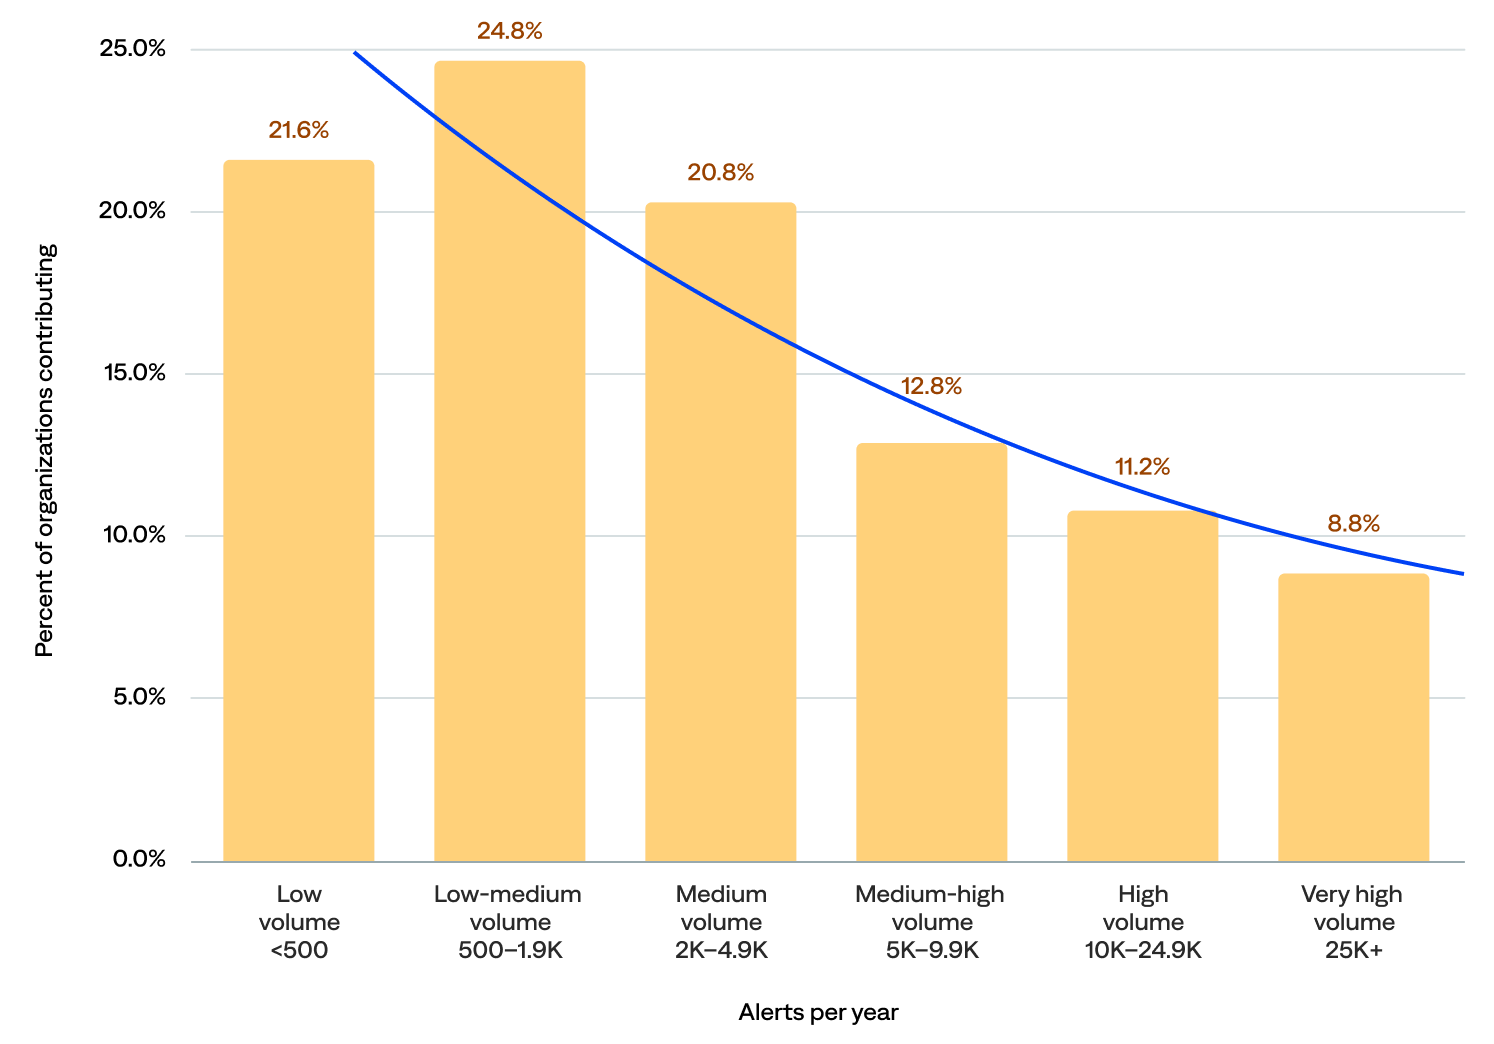
Daily alert volume (n=125)
Alert enrichment
Alert enrichment (or event enrichment) refers to adding additional context, such as CMDB, operational, and business logic data, to alerts and events from external data sources.
The BigPanda event enrichment engine leverages existing relationship information for mapping enrichments, quickly improving alert quality and reducing time to triage by providing cross-domain alert enrichment with rich contextual data. This enrichment enables operators to identify meaningful patterns and promptly take action to prioritize and mitigate major incidents.
A higher percentage of data enrichment leads to better-quality incidents.
Low alert enrichment could mean organizations pre-enrich alerts before sending them to BigPanda, maintain poor CMDB workflows, or have poor CMDB quality.
High alert enrichment could indicate a rigid process in which alerts are highly standardized and thus always matched against an external data source.
Most organizations had configured the rules to create enrichment maps (94%), the rules to extract data from the enrichment maps to an external source such as ServiceNow (96%), and the composition rules for enrichment (97%).
This section reviews details about the enrichment integrations and the enriched alerts.
of organizations had configured the rules to create enrichment maps
“BigPanda has significantly helped with deduplicating, correlating, and automating our process. The enrichment data we process through BigPanda enables us to create more specific and insightful alert tags.”
–Supervisor of IT Operations, Healthcare Enterprise
Enrichment integrations and maps
BigPanda includes four standard enrichment integrations that ingest contextual data from configuration management, cloud and virtualization management, service discovery, APM, topology, and CMDB tools (Datadog, Dynatrace, ServiceNow, and VMware vCenter) to create a full-stack, up-to-date model that enriches BigPanda alerts. Customers can also create custom enrichment integrations.
This section reviews which maps (tables) the organizations uploaded to enrich their data. The organizations in this report uploaded 6,160 enrichment maps.
- Over a third (38%) of organizations used a standard enrichment integration (Datadog, Dynatrace, ServiceNow, and/or VMware vCenter), and 78% of the enrichment maps came from standard integrations.
- The known data source with the most integrations was the ServiceNow CMDB (26%).
- Most enrichment maps came from the ServiceNow CMDB (42%) and Dynatrace (30%).
of the enrichment maps came from the ServiceNow CMDB
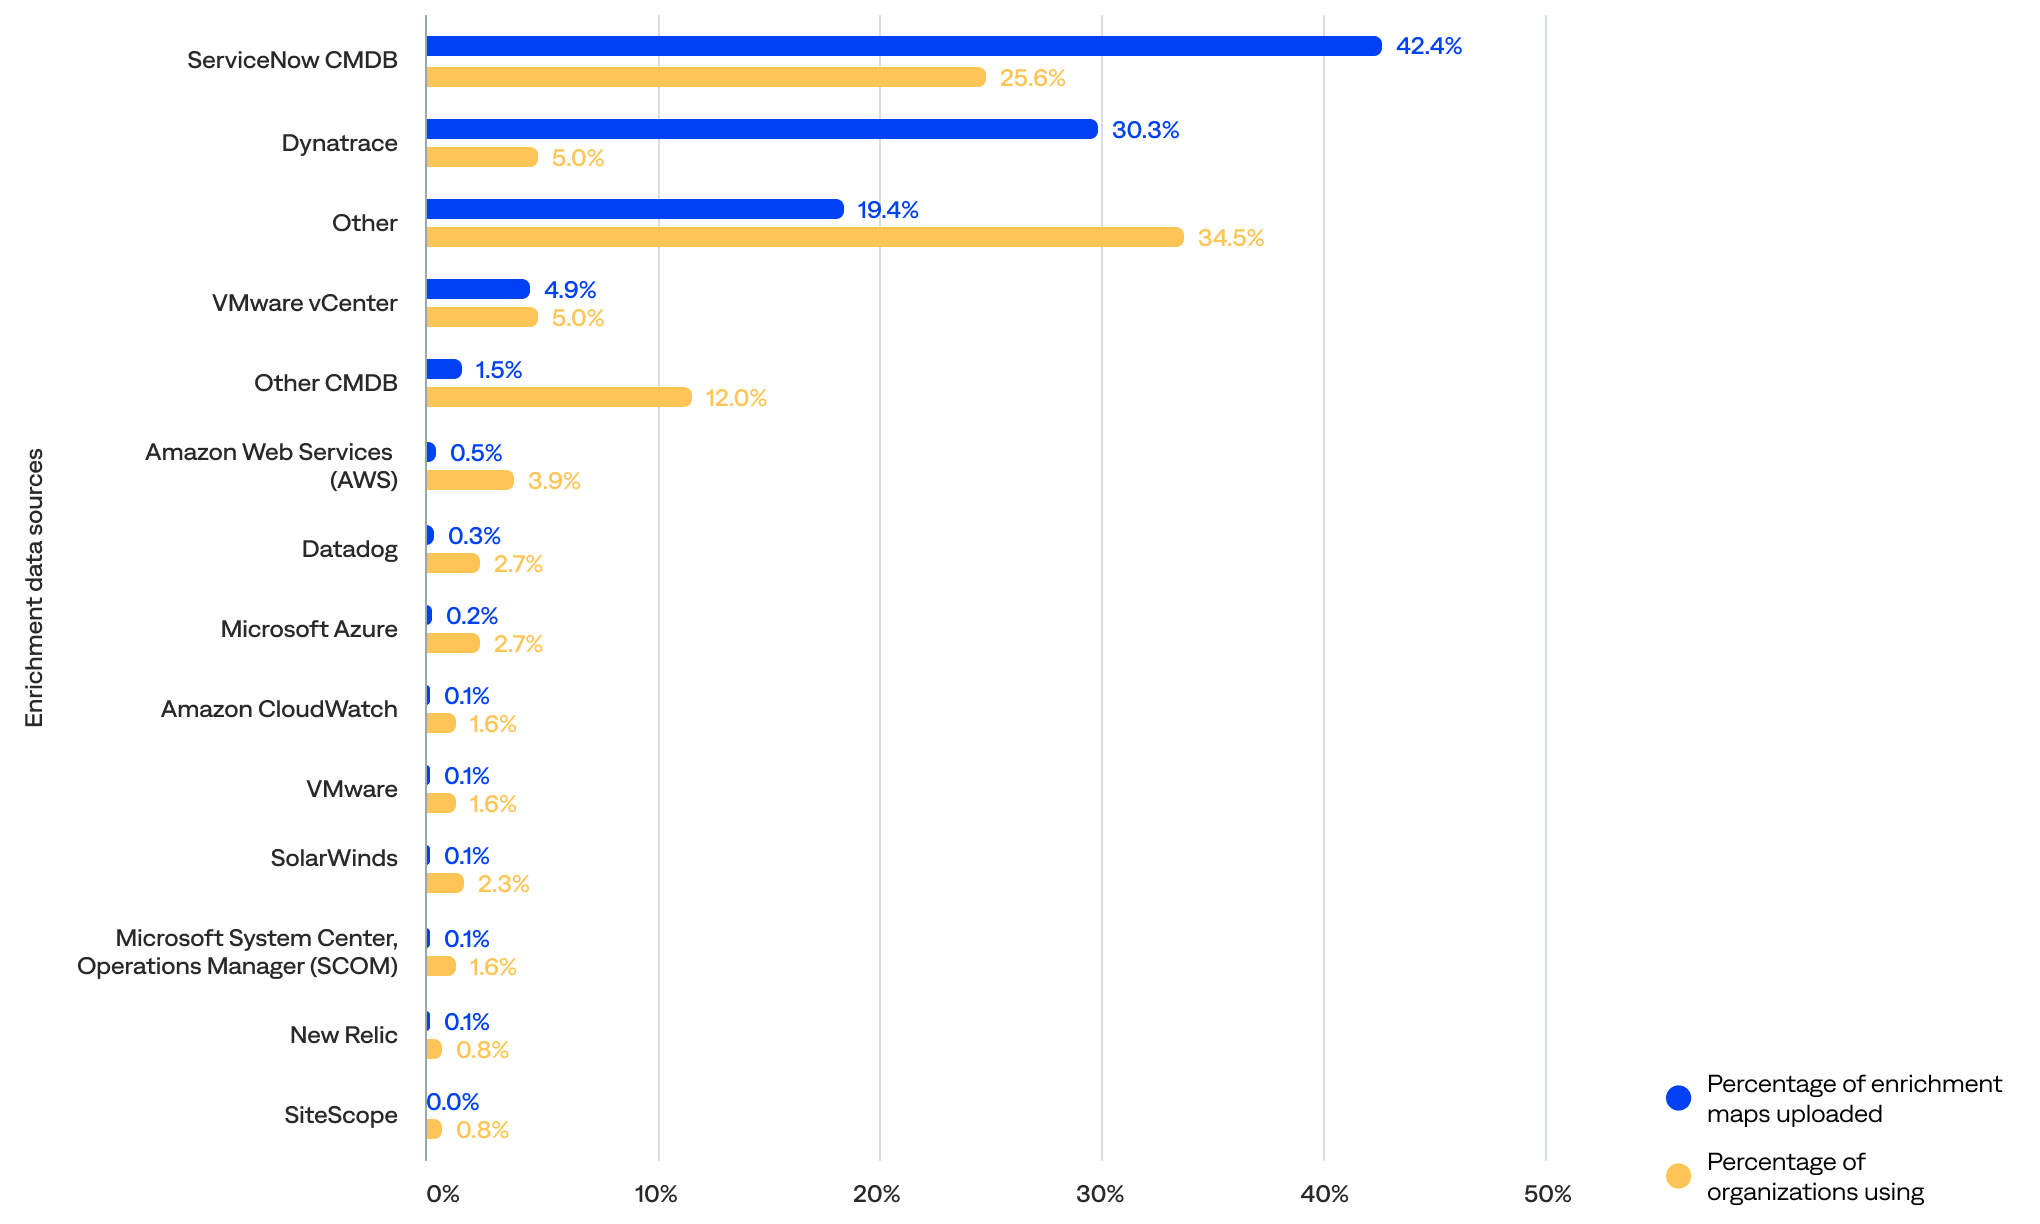


Percentage of enrichment maps uploaded and organizations using each enrichment data source
Enriched alerts
Nearly two-thirds (60%) of alerts were enriched for all incidents, and 77% were enriched for actioned incidents (mapping enrichment specifically). The median percentage of alerts enriched for all incidents per organization was 63%, and the median for all actioned incidents was 74%.
- The distribution is polarized, with about 20% of organizations either doing very little enrichment (0–10%) or achieving extremely high enrichment (90–100%). This suggests that organizations don’t gradually climb the enrichment ladder—they either commit fully or stay minimal.
- Nearly two-thirds (60%) had enriched at least 50% of their alerts, including 35% that had enriched at least 75% and 17% that had enriched at least 90%.
- Only 20% had enriched less than 10% of their alerts, including 9% that did not enrich alerts. This could represent onboarding organizations or organizations in the early stages of observability maturity.
of alerts were enriched for all incidents
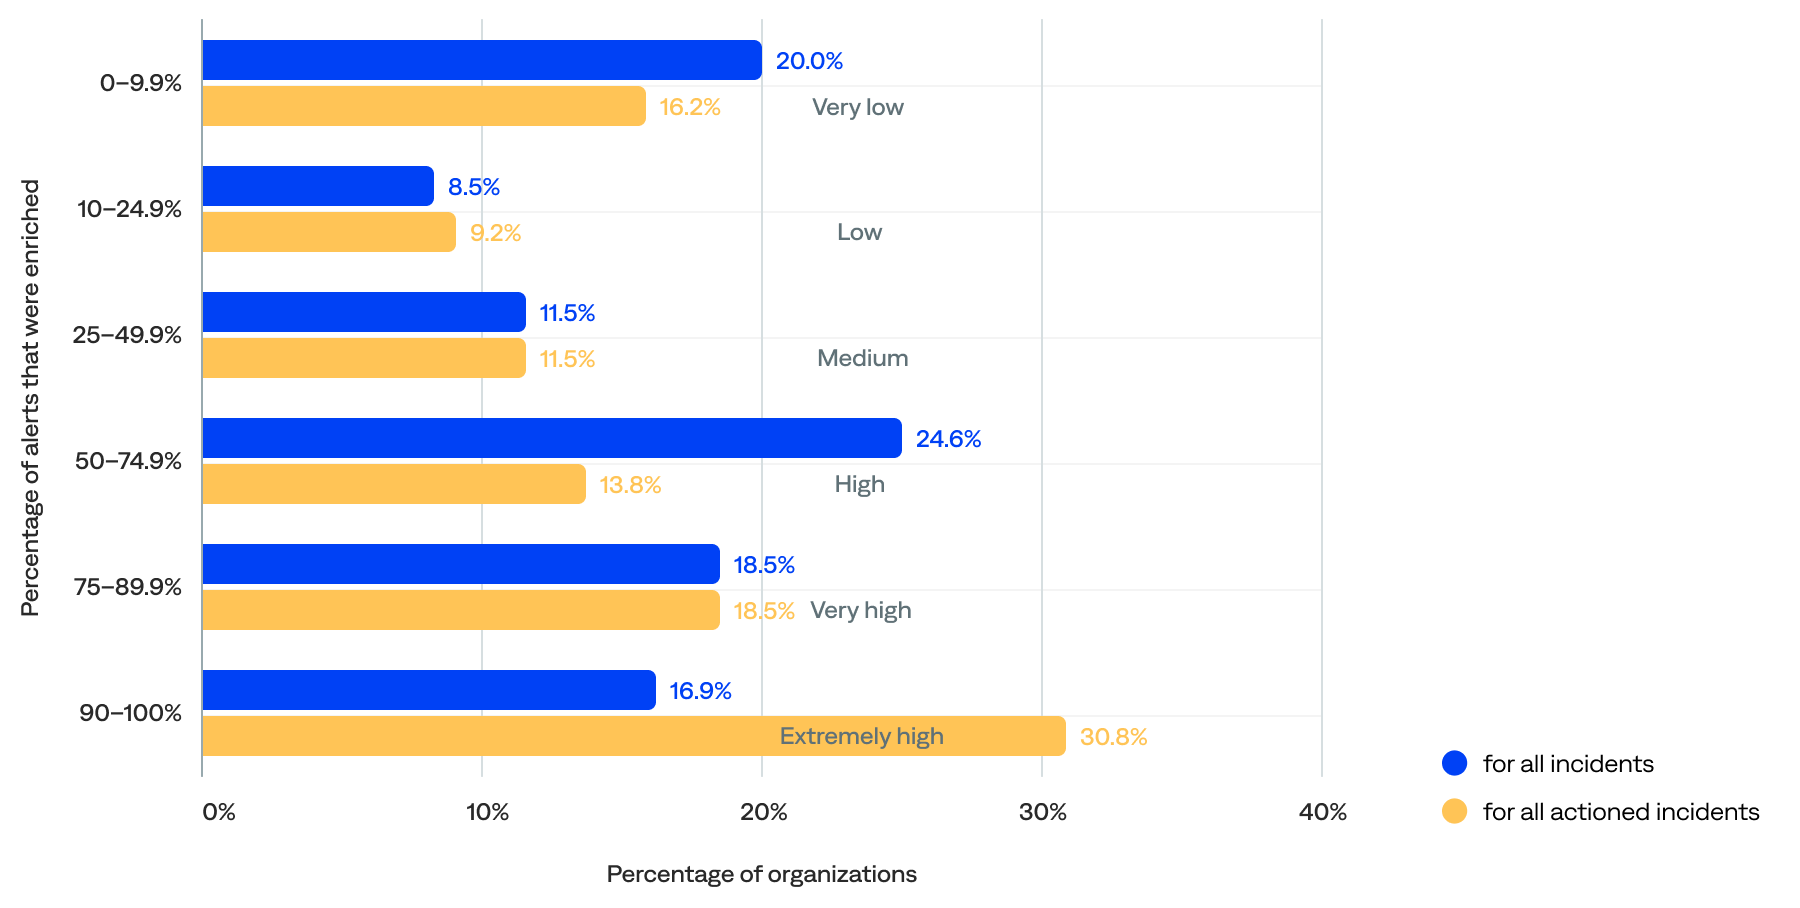
Percentage of alerts that were enriched for all incidents and all actioned incidents per organization
Alert correlation patterns
Correlation patterns set rules to define relationships between system elements, which BigPanda then uses to cluster alerts into incidents dynamically. They define the relationships between alerts using parameters, including the source system, tags, the time window, and an optional filter.
Teams can customize alert correlation patterns to align with the specifics of their infrastructure. They can also enable cross-source correlation, which correlates alerts from different source systems into the same incident.
Correlation patterns are easy to configure in BigPanda. In fact, all organizations had configured correlation patterns. There were 2,723 active correlation patterns, with a median of 14 per organization.
of organizations had 10+ active alert correlation patterns
- Nearly two-thirds (63%) of organizations had 10 or more active correlation patterns configured, including 40% with 20 or more.
- The industries with the highest median active correlation patterns configured were transportation (41), energy/utilities (32), and media/entertainment (26). Those with the lowest were telecommunications (9), MSPs (10), and manufacturing (10).
- Most (92%) correlation patterns were non-system-generated.
- Over half (52%) of all active correlation patterns had cross-source correlation enabled.
- Over half (53%) had correlation patterns with one tag, 30% had two tags, and 17% had three or more tags.
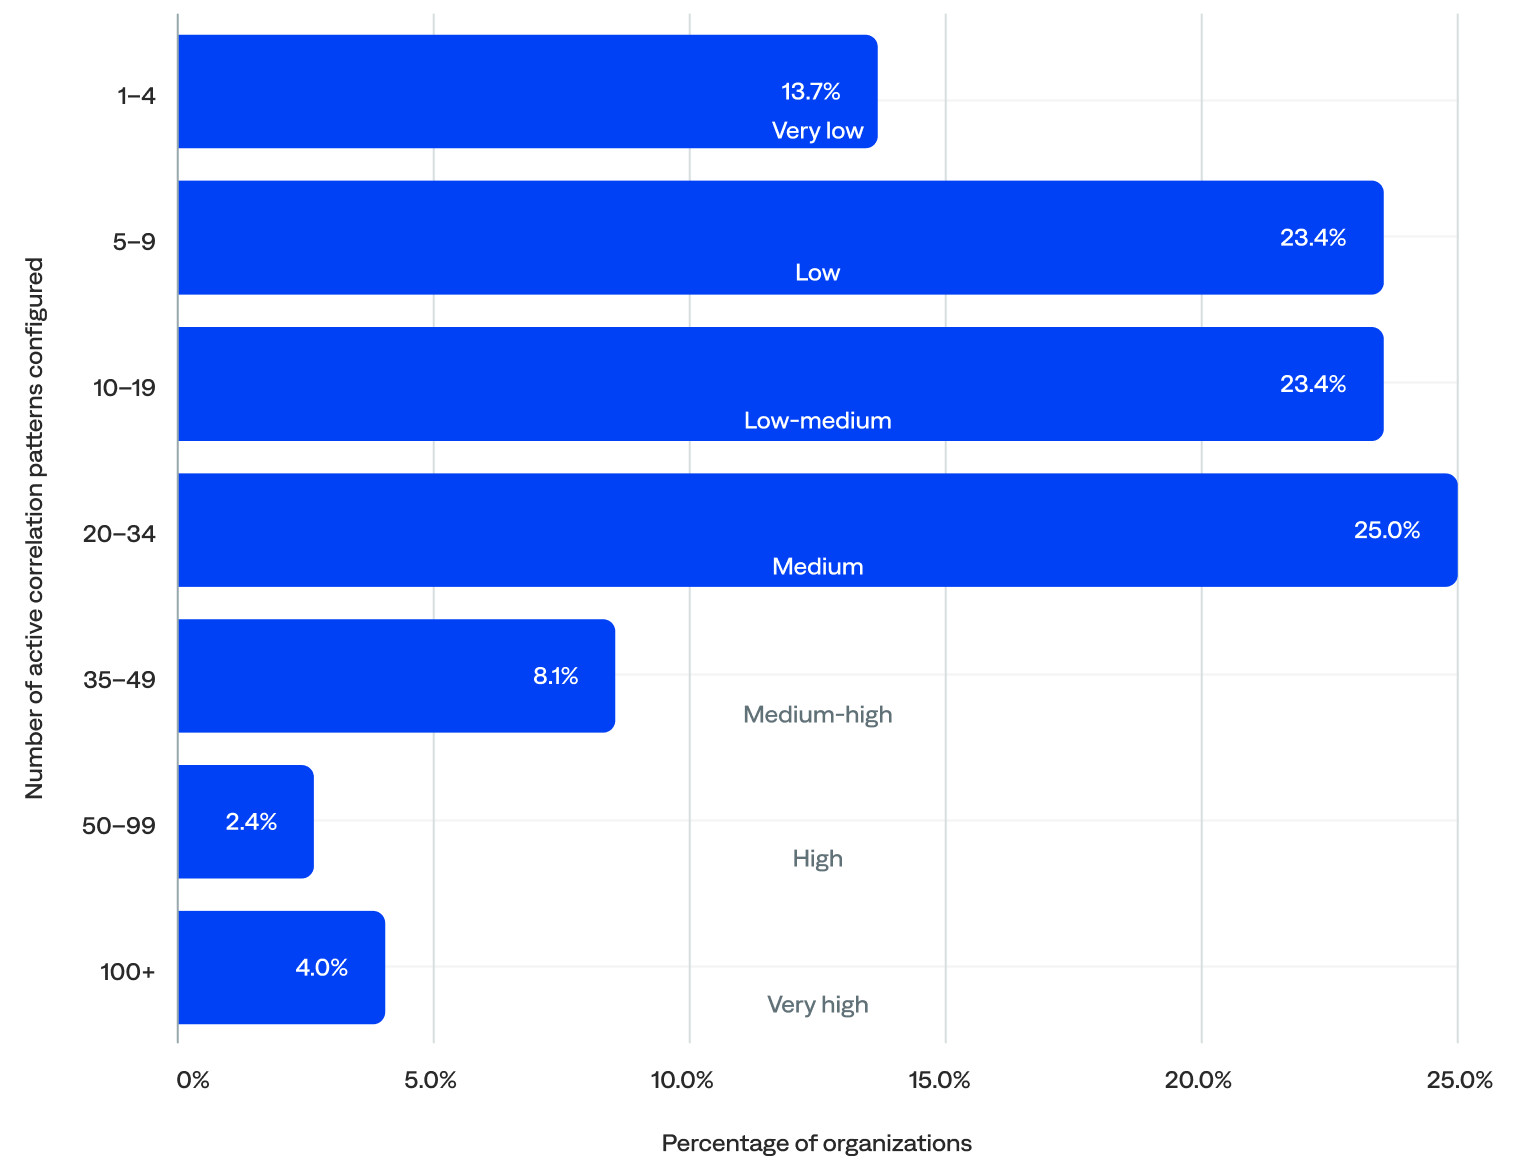
Percentage of active correlation patterns configured per organization (n=124)
“Not only can we see the alerts, but we can evaluate them using correlation that recognizes patterns, connects alerts, and leads to fewer incidents.”
–Head of Automation and Monitoring, Telecommunications Enterprise

- PlatformPlatform
- Agentic IT Operations
- Platform Overview
- AI Detection & Response
- AI Incident Assistant
- AI Incident Prevention
- IT Knowledge Graph
- BigPanda AIOps
- BigPanda Core
- Advanced Insight
- Biggy AI
- Rebranding Matrix
- Integrations
- Features
- Detection
- Open Integration Hub
- Event Correlation
- AI Detection
- Triage
- Automated Incident Triage
- Root Cause Analysis
- Similar Incidents