Detection benchmarks
Teams use BigPanda to detect events during pipeline processing, including:
- Correlating alerts across applications and services
- Enriching alerts for greater intelligence
- Minimizing alert noise and fatigue
This section reviews the BigPanda event-to-incident lifecycle.
Key detection highlights:
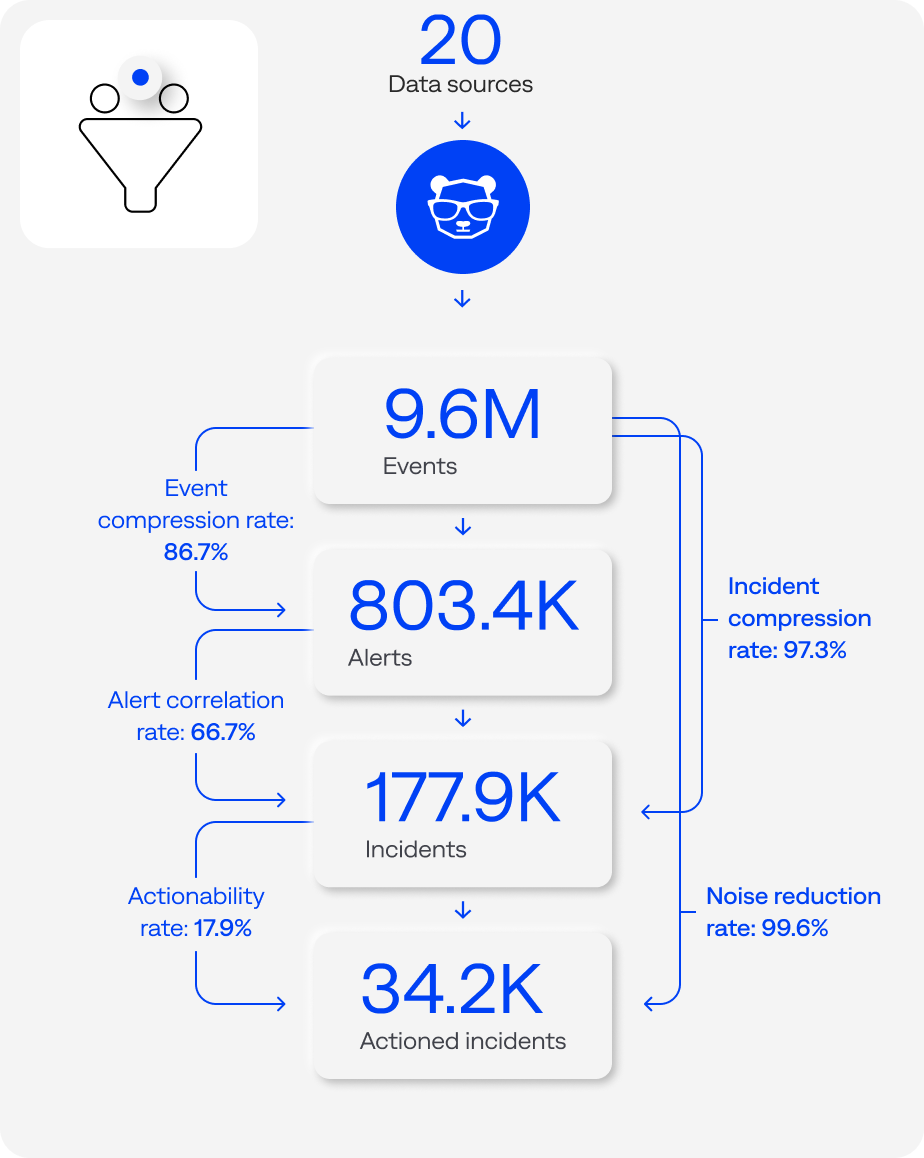
Pipeline processing funnel (events-to-incidents workflow or lifecycle) median detection benchmarks per organization (n=125)
Events
An event is a point in time that represents the state of a service, application, or infrastructure component.
The pipeline process starts when BigPanda receives and ingests event data from monitoring and observability tools. These tools can generate events when potential problems are detected in the infrastructure.
This section reviews the volume of events, when events tend to occur, and event compression.
Key event highlights:
Event volume
BigPanda ingested nearly 6 billion events from inbound monitoring and change integrations.
When we remove the five outliers (fewer than 100,000 and 1 billion or more annual events), BigPanda ingested 4.5 billion events. The median annual events per organization was 9.6 million, and the median daily events per organization was 28,623.
- Half (50%) of the organizations generated at least 10 million events, including 17% that contributed 50 million or more events, representing 55% of the total annual event volume.
- Nearly three-quarters (72%) generated between 1 million and 50 million events, representing 20% of the total annual event volume.
- Typical or moderate-sized annual event counts ranged from 10 million to 50 million. A third (33%) of organizations fell in this medium volume range, representing 17% of the total annual event volume.
- Over a third (39%) generated a low-medium volume of annual events in the single-digit millions (at least 1 million but fewer than 10 million annual events), representing just 3% of the total yearly event volume.
- The remaining 11% had minimal volume (at least 100,000 but fewer than 1 million events per year), which may indicate that they were still onboarding.
of organizations sent 10M+ events per year to BigPanda
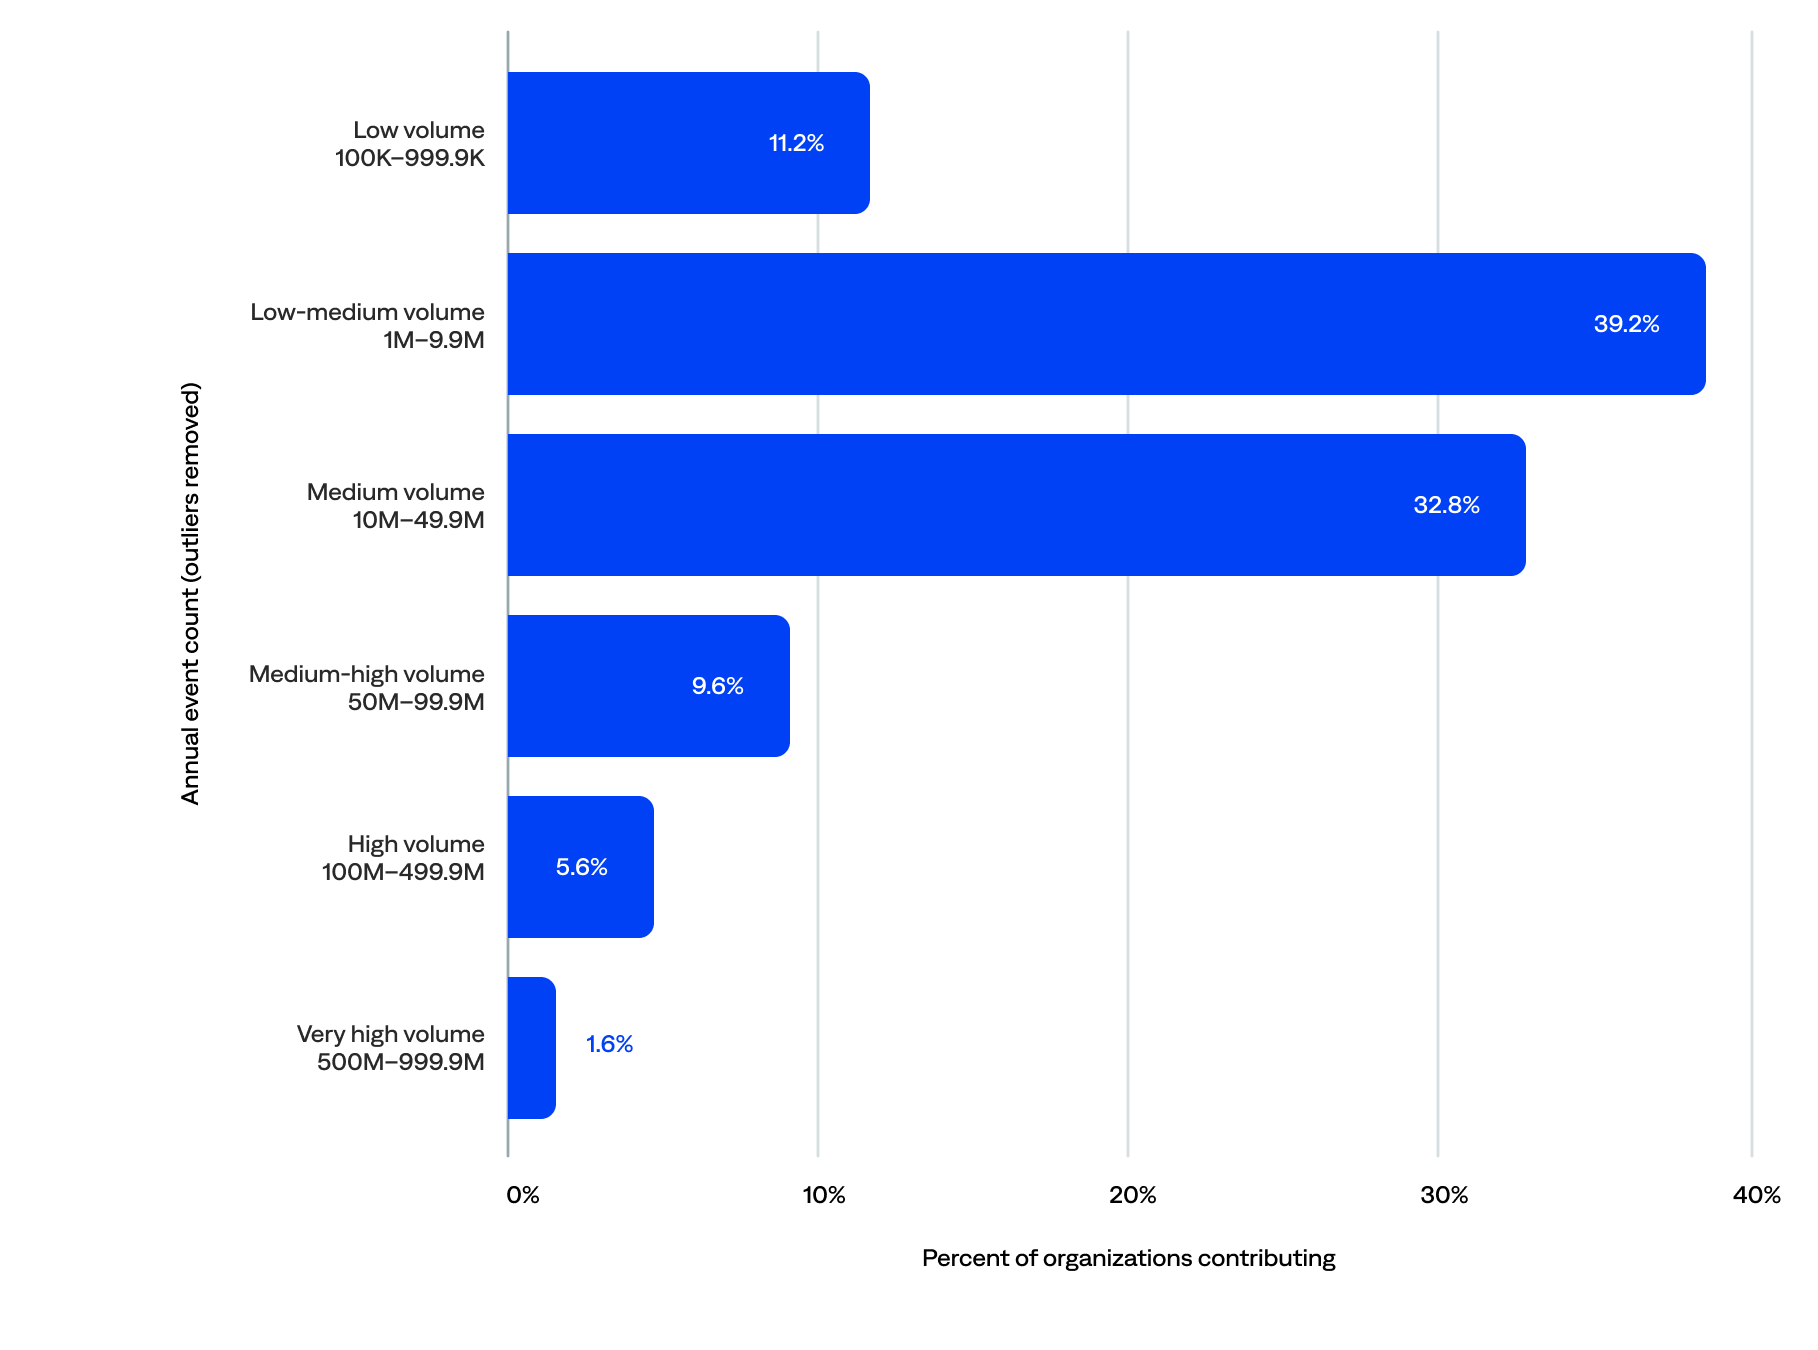
Annual event volume (n=125)
When events occur
This section reviews when events occur based on the UTC (Coordinated Universal Time, also known as Greenwich Mean Time or GMT) time zone.
By month of the year
The event count ranged from about 374.3 million to 540.2 million per month.
- The most events occurred in October (10.3%), followed by November (9.9%) and July (9.2%).
- The fewest events occurred in April (7.1%), followed by January (7.2%) and February (7.3%).
- When we compare by seasons, 29% happened in September, October, and November, 26% in June, July, and August, 23% in March, April, and May, and 22% in December, January, and February.
of events occurred in September, October, and November
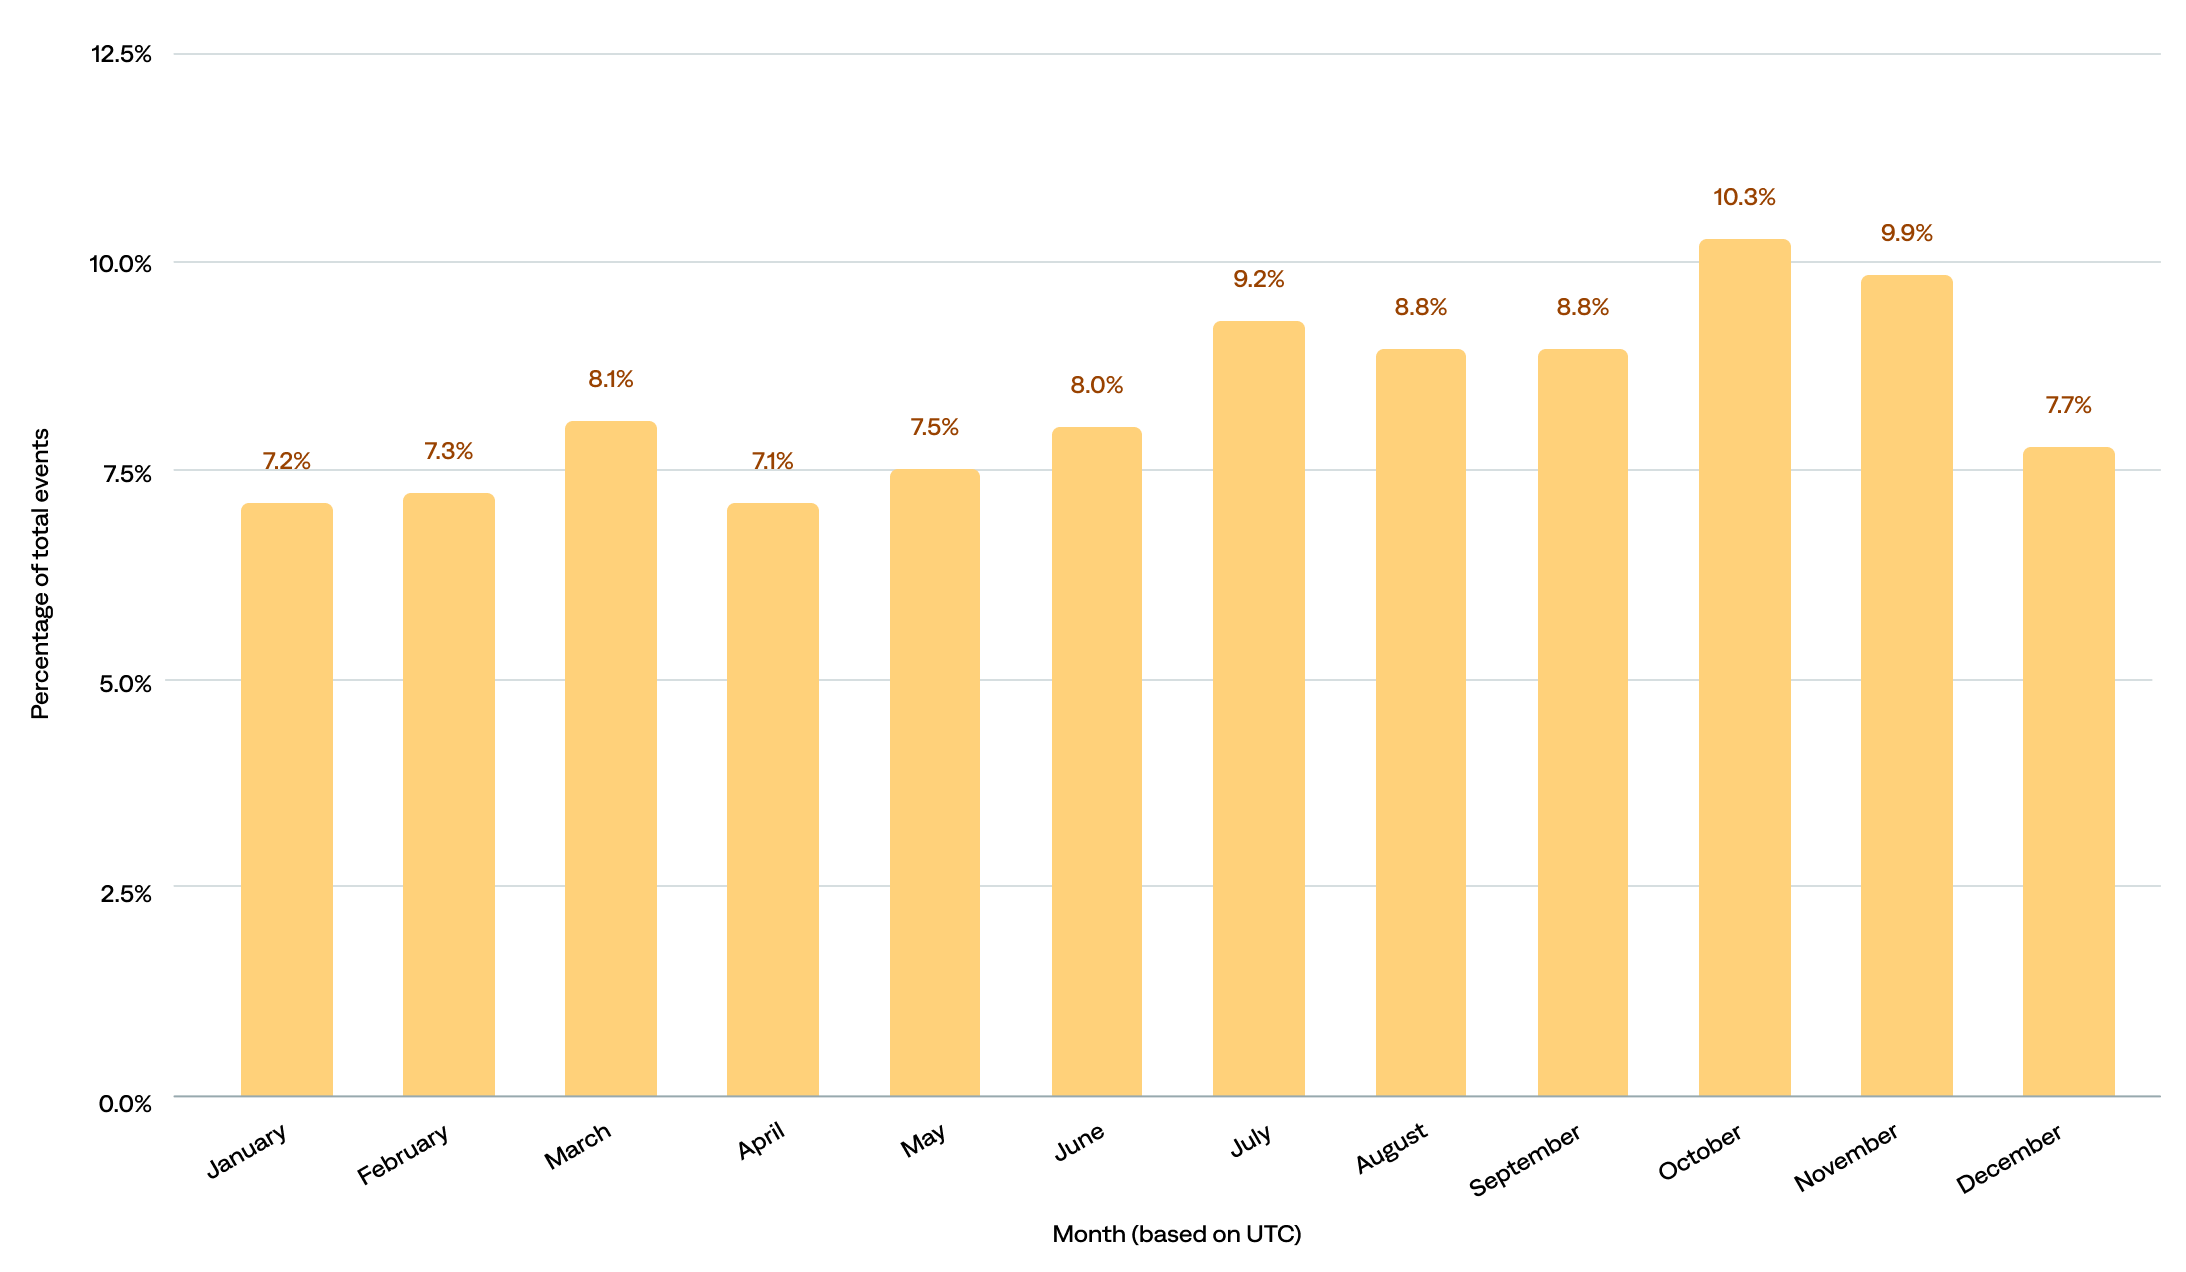
Percentage of total events by month in UTC (n=114)
By day of the week
As far as what day of the week events tend to happen, the data show that:
- Nearly three-quarters (73%) of events occurred on weekdays; Monday–Friday consistently saw higher activity, averaging over 767 million events per day.
- The peak event days were Wednesday, Thursday, and Friday, with 15% each or 45% total, compared to 14% each (28% total) for Monday and Tuesday.
- Weekends show a slight drop-off in events, with about 14% on Saturday and 13% on Sunday. However, 27% of events still occurred on weekends, which is bad news for those on call.
of events occurred on a weekend
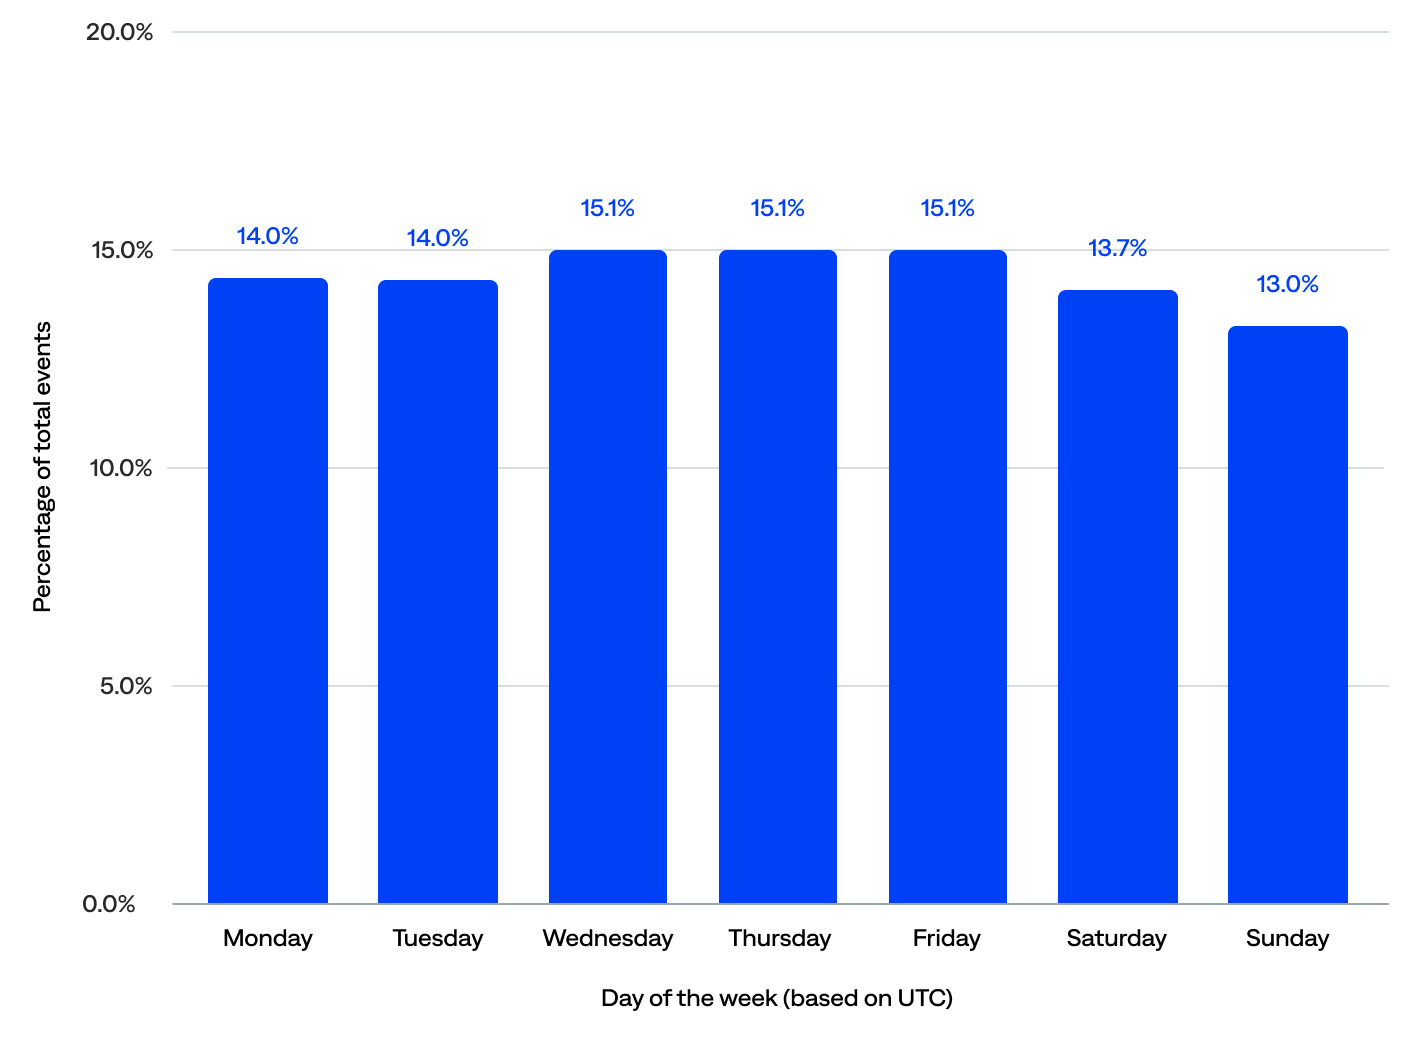
Percentage of total events by day of the week in UTC (n=114)
Event compression
Event compression is the number of events compressed into alerts. It consists of deduplication and alert filtering, which help prevent events from becoming alerts. Therefore, higher event compression rates correlate with less alert noise.
The median event compression rate was 87%.
Many organizations had achieved high compression, while others had room to improve (low and average compression):
- One in four (25%) had achieved high compression (95% or higher), suggesting strong use of deduplication and alert filtering. These organizations likely experienced less alert fatigue, a better signal-to-noise ratio, and lower support overhead.
- The majority (59%) fell into the average compression range (70–94%), which suggests they had taken steps to reduce noise but hadn’t fully optimized their setup.
- Only 17% were in the low compression range (<70%), likely due to early-stage adoption (still onboarding) or poor use of deduplication and alert filtering. They may have experienced high alert noise, a poor signal-to-noise ratio, or incomplete configurations.
of organizations achieved a high event compression rate (95+%)
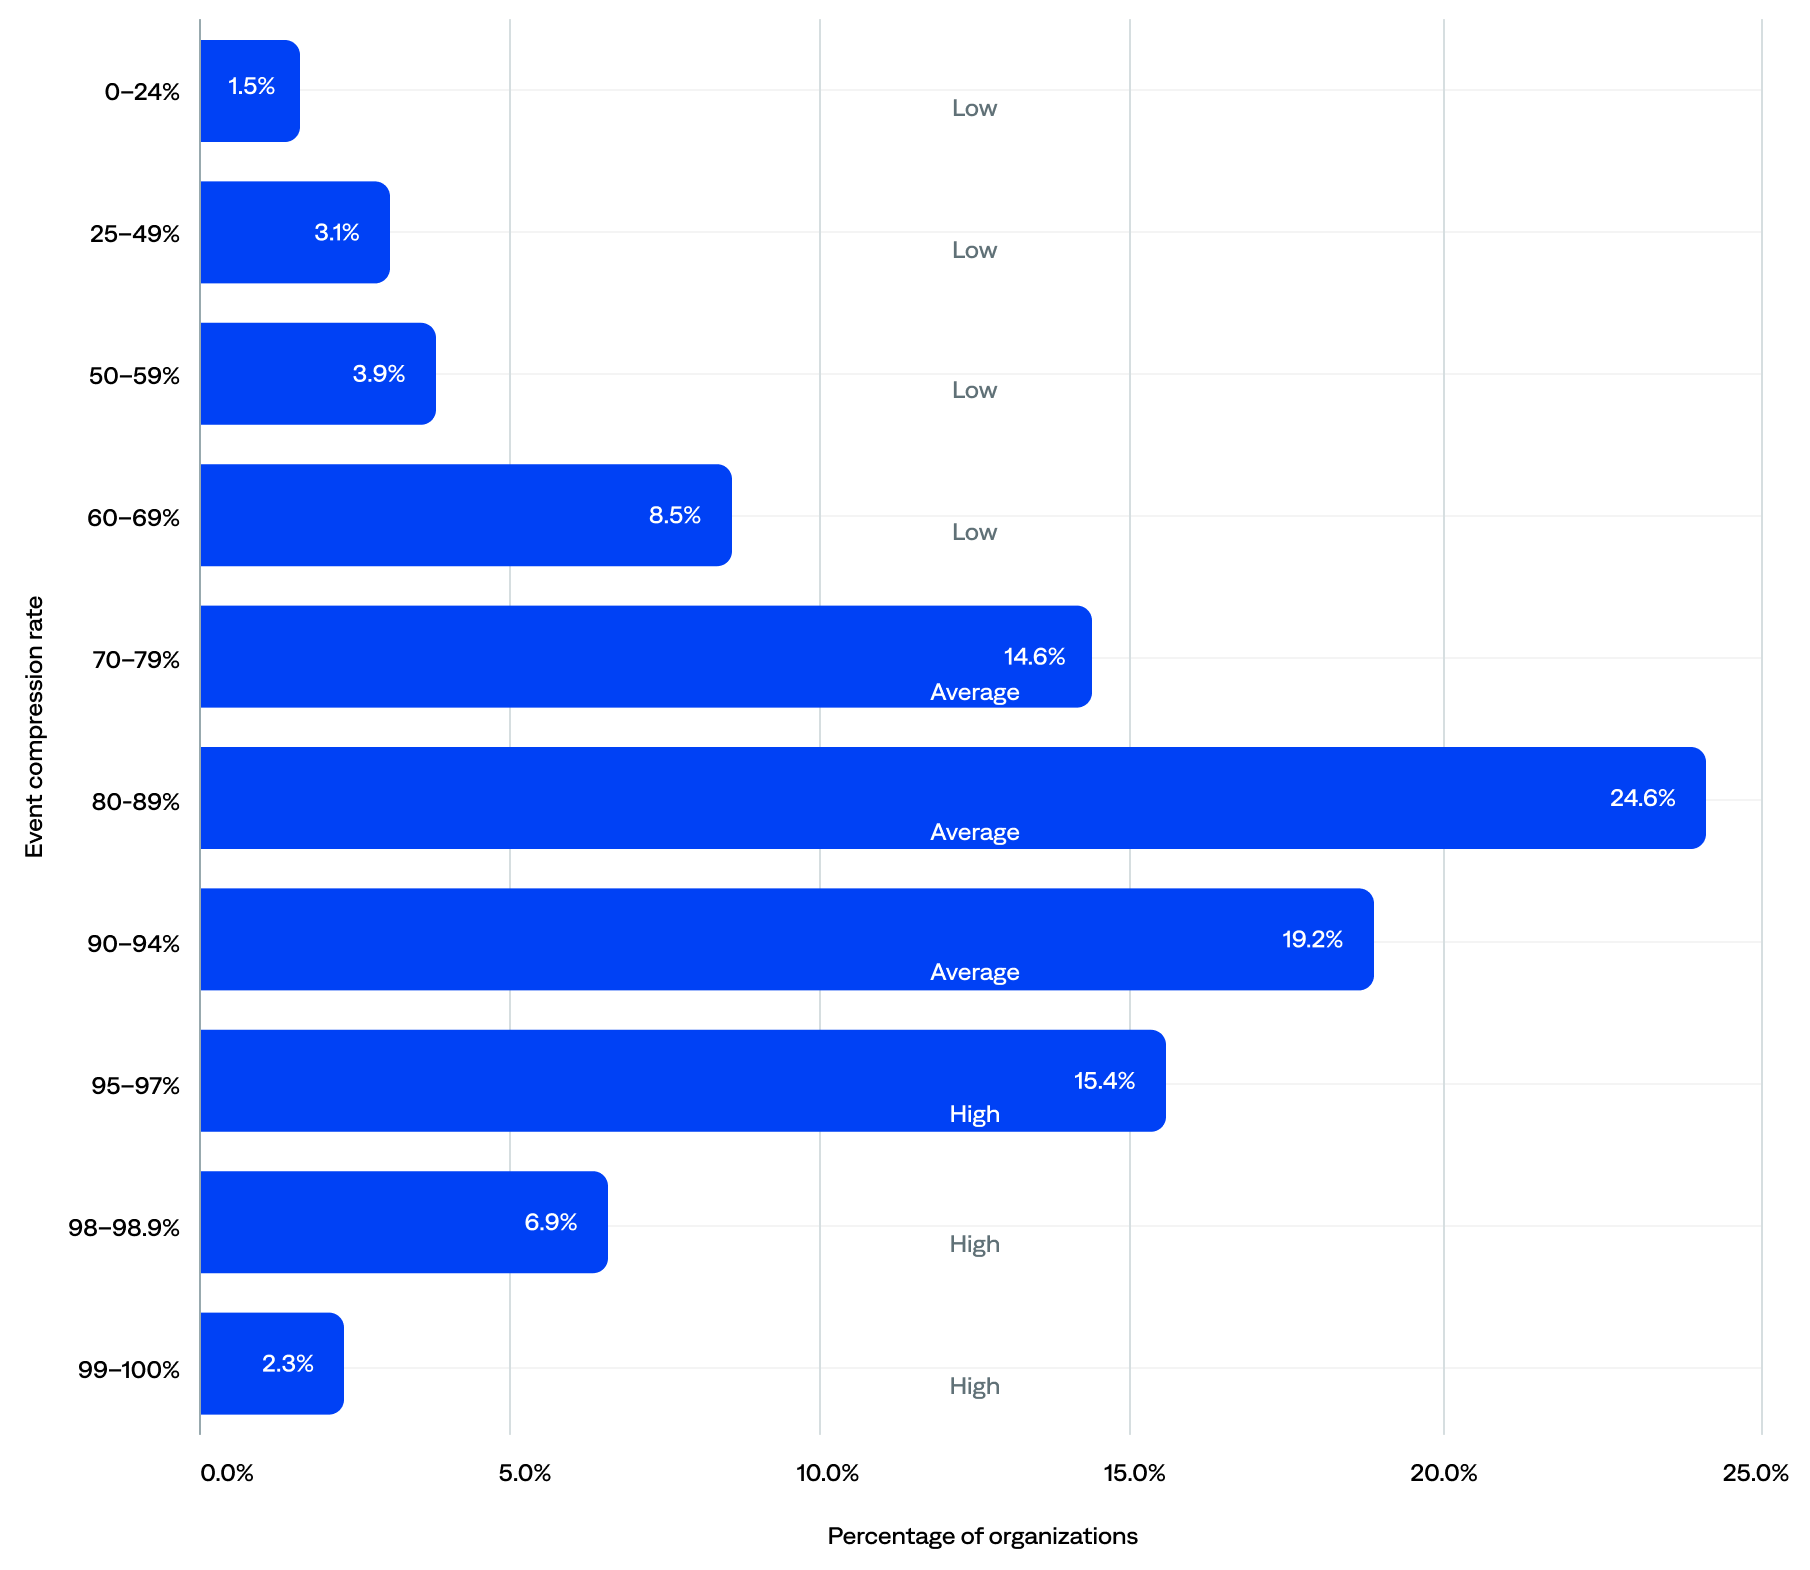
Event compression rate range and tier by organization (n=125)
Deduplication
Also known as event deduplication, deduping is the process by which BigPanda eliminates redundant data to reduce noise and simplify incident investigation. Deduplicated events are events that were removed as precise duplicates.
BigPanda has a built-in deduplication process that reduces noise by intelligently parsing incoming raw events. It groups events into alerts based on matching properties. Exact duplicate matches add clutter to the system and are not actionable. BigPanda discards precise duplicates of existing events immediately. However, it merges updates to existing alerts rather than creating a brand-new alert.
The median deduplication rate was 93.6%.
- Most (63%) organizations had deduplication rates of 90% or more, including 42% with rates of 95% or more, and 18% clustering around the 99% mark—enabling them to focus only on incidents that matter.
- The remaining 37% had deduplication rates of less than 90%, likely due to subpar configuration, purposely choosing not to deduplicate, or poor quality data that’s difficult to dedupe well.
- Just 10% of the total events were deduplicated into alerts. In other words, in 2024, BigPanda helped prevent 90% of noisy alerts (event deduplication rate). Put another way, on average, BigPanda helped prevent over 43 million alerts per organization per year.
of organizations benefited from 90+% event deduplication

Deduplication rate per organization
Alert filtering
In the context of BigPanda, alert filtering is a feature that allows users to filter out or suppress specific alerts. Filtered-out events are unactionable events that were filtered out using alert filters.
Filtering alerts helps ITOps teams stop duplicate, low-relevance events from being correlated into incidents. Stopping alert noise before it reaches the incident feed enables teams to focus on the most important incidents and spend their time and effort on the most critical issues.
Alert filtering affects alerts after they have been normalized and enriched. The added context of the enrichment process enables teams to filter events based on alert metadata and enrichment tags.
Over half (55%) of organizations had configured at least one alert filter in BigPanda. The remaining 45% likely configured alert filters upstream before they reach BigPanda.
Excluding organizations with no alert filters, the median alert filters per organization was two. Of those organizations that had configured alert filters:
- Over two-thirds (67%) configured 1–5.
- Nearly a quarter (22%) configured 6–24.
- About one in ten (11%) configured 25 or more.
of organizations configured at least one alert filter in BigPanda
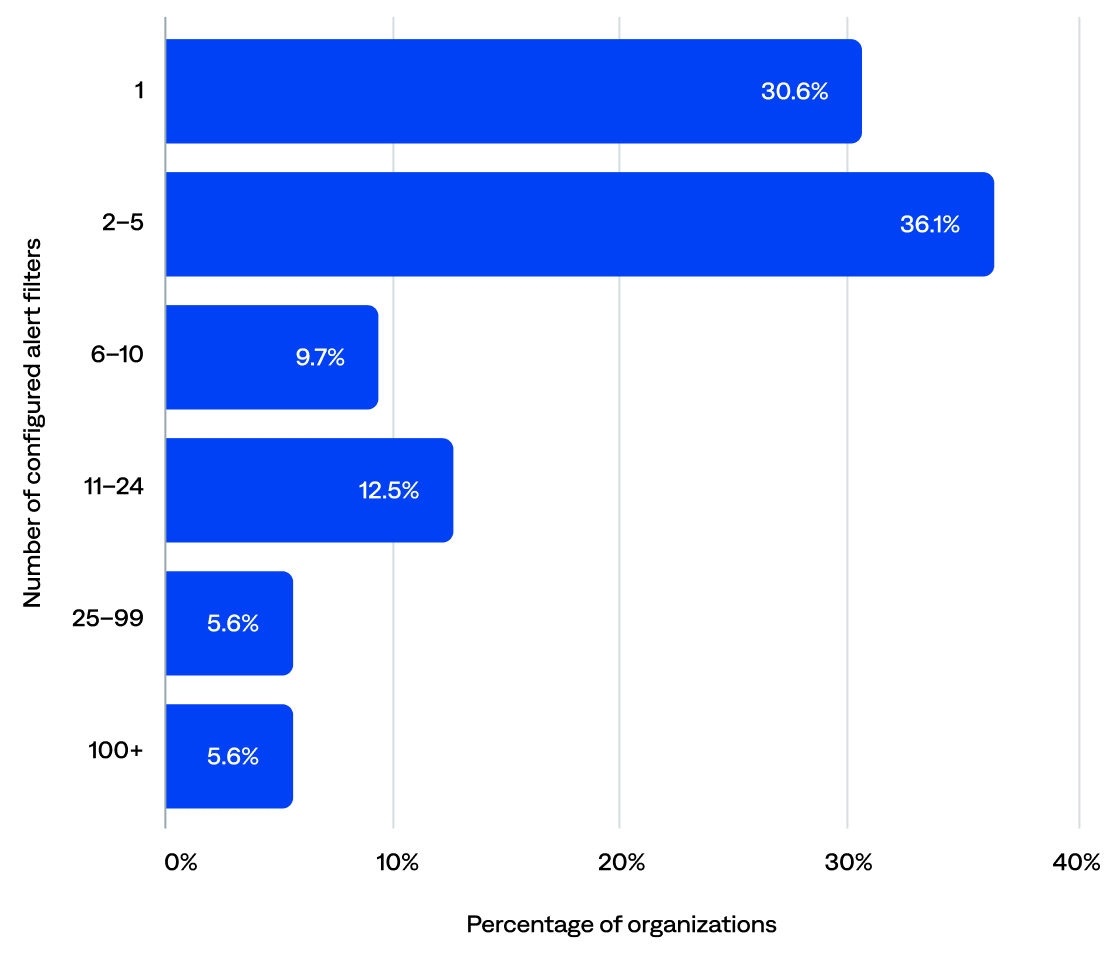
Number of configured alert filters per organization (n=72)
Alerts
An alert is the combined lifecycle of a single system issue.
Monitoring and observability tools generate events when potential problems are detected in the infrastructure. Over time, status updates and repeat events may occur due to the same system issue.
In BigPanda, raw event data is merged into a singular alert so that teams can visualize the lifecycle of a detected issue over time. BigPanda correlates related alerts into incidents for visibility into high-level, actionable problems.
This section reviews the annual and daily alert volume and information about alert enrichment and correlation patterns.
Key alert highlights:
“Before BigPanda, we had times when multiple incidents would trigger alerts from three or four different monitoring and observability tools. With all that noise, we didn’t have visibility into alert impact, and could not quickly identify the root cause to know where to focus our triage efforts. With BigPanda, our IT noise is not only reduced, but we can identify the root cause in real time—who the responsible team is, who owns the alerting service, etc.—which is significantly reducing our MTTR.”
–Staff Software Systems Engineer, Manufacturing Enterprise
Alert volume
This section reviews the annual and daily alert volume for the organizations included in this report.
Annual alert volume
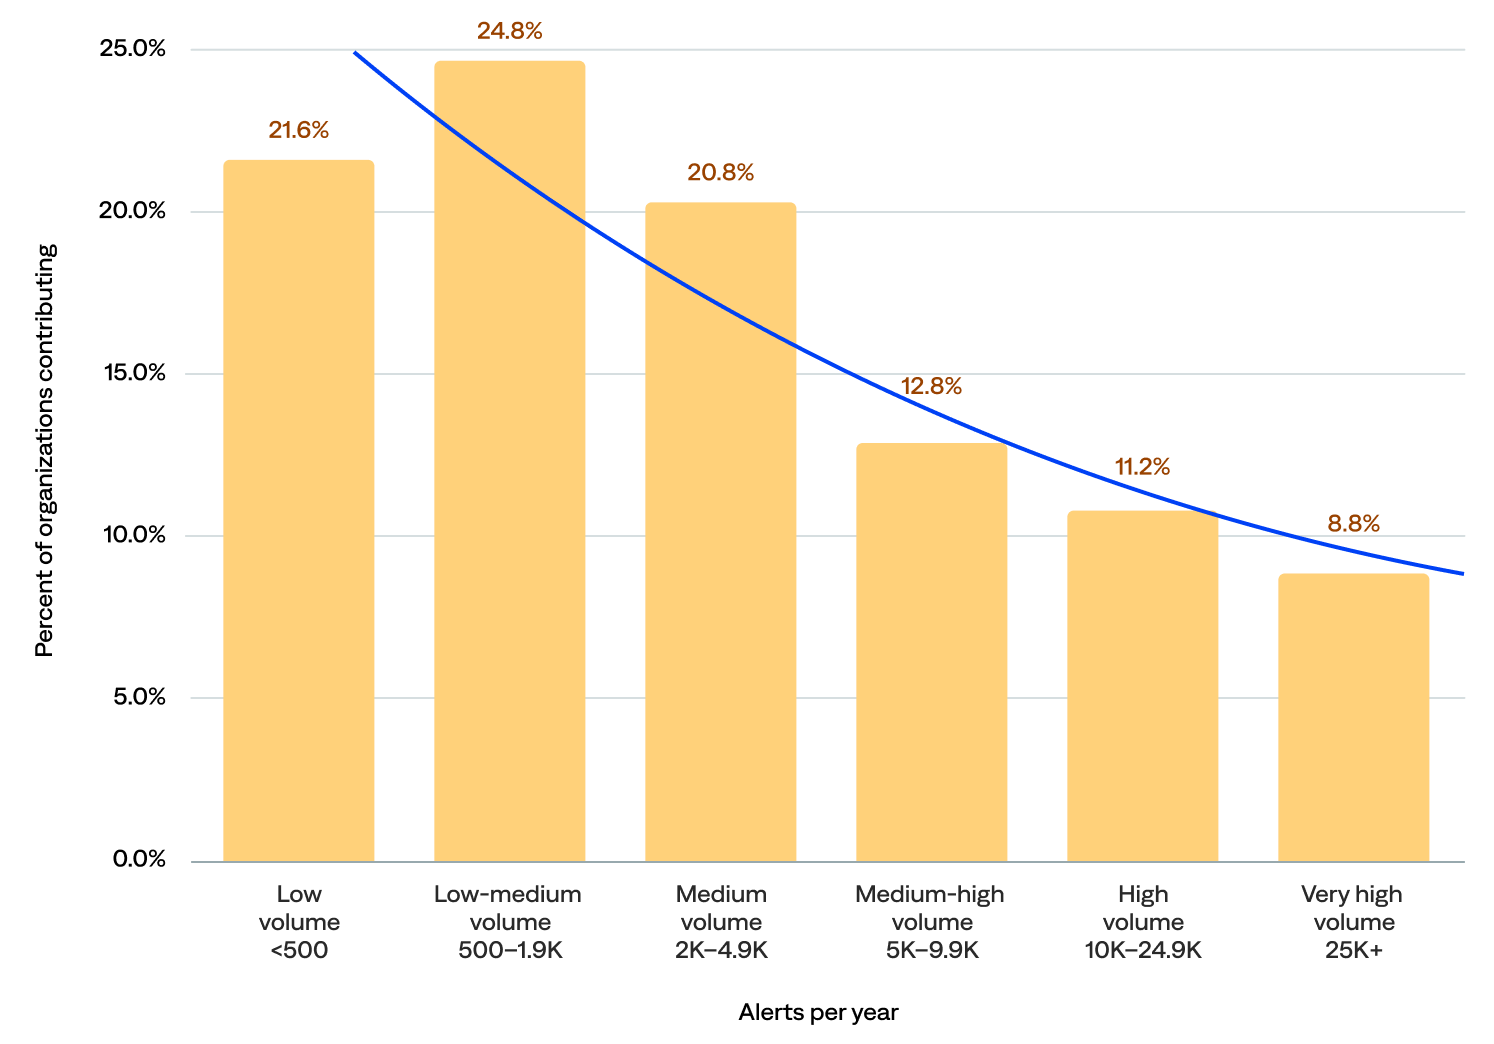
BigPanda generated over 587 million alerts in 2024. After filtering out the five event outliers, the total alert count was over 493 million, and the median annual alert volume was 803,406.
- Low and low-medium alert volume: Over two-thirds (69%) of organizations generated fewer than 2 million alerts per year.
- Medium and medium-high alert volume: Nearly a quarter (22%) generated at least 2 million but fewer than 10 million alerts per year.
- High and very high alert volume: Only 8% generated more than 10 million alerts per year.
of organizations generated 2M+ alerts per year in BigPanda
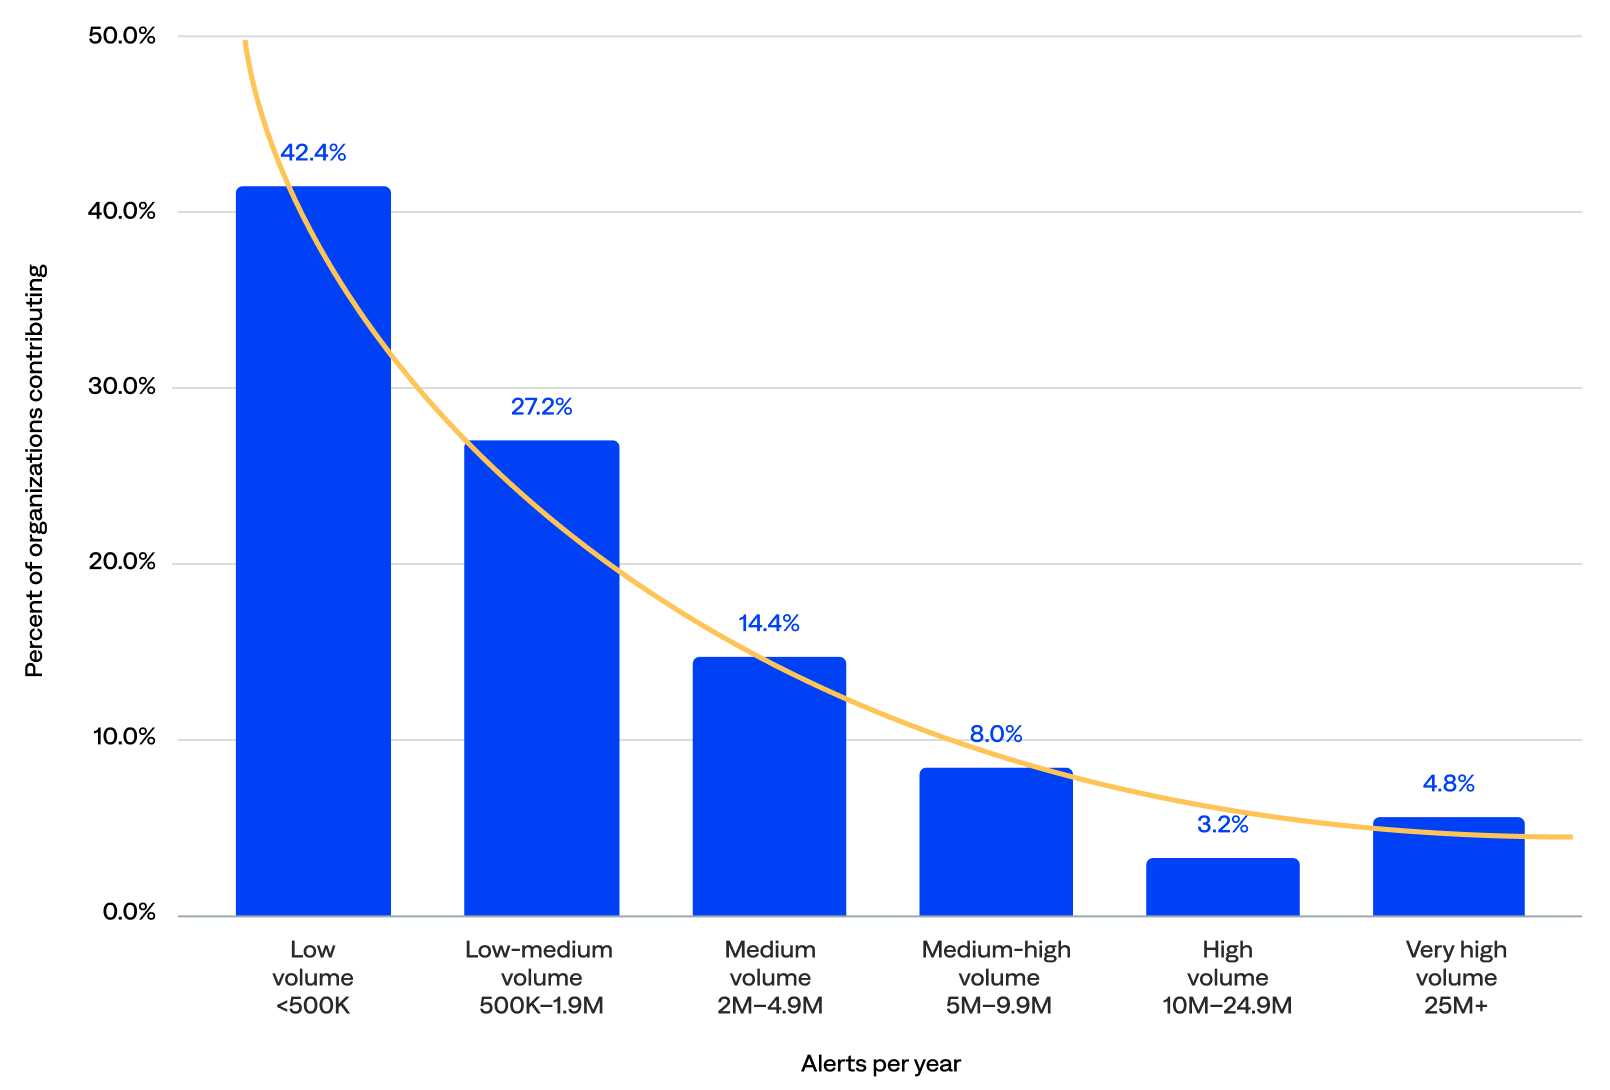
Annual alert volume (n=125)
Daily alert volume
The median daily alert volume was 2,350.
- Low and low-medium alert volume: Nearly half (46%) of organizations experienced fewer than 2,000 alerts per day, including 22% with fewer than 500.
- Medium and medium-high alert volume: About a third (34%) experienced at least 2,000 but fewer than 10,000 alerts per day.
- High and very high alert volume: One in five (20%) experienced 10,000 or more alerts per day, including 9% wi
of organizations generated 2K+ alerts per day in BigPanda
Daily alert volume (n=125)
Alert enrichment
Alert enrichment (or event enrichment) refers to adding additional context, such as CMDB, operational, and business logic data, to alerts and events from external data sources.
The BigPanda event enrichment engine leverages existing relationship information for mapping enrichments, quickly improving alert quality and reducing time to triage by providing cross-domain alert enrichment with rich contextual data. This enrichment enables operators to identify meaningful patterns and promptly take action to prioritize and mitigate major incidents.
A higher percentage of data enrichment leads to better-quality incidents.
Low alert enrichment could mean organizations pre-enrich alerts before sending them to BigPanda, maintain poor CMDB workflows, or have poor CMDB quality.
High alert enrichment could indicate a rigid process in which alerts are highly standardized and thus always matched against an external data source.
Most organizations had configured the rules to create enrichment maps (94%), the rules to extract data from the enrichment maps to an external source such as ServiceNow (96%), and the composition rules for enrichment (97%).
This section reviews details about the enrichment integrations and the enriched alerts.
of organizations had configured the rules to create enrichment maps
“BigPanda has significantly helped with deduplicating, correlating, and automating our process. The enrichment data we process through BigPanda enables us to create more specific and insightful alert tags.”
–Supervisor of IT Operations, Healthcare Enterprise
Enrichment integrations and maps
BigPanda includes four standard enrichment integrations that ingest contextual data from configuration management, cloud and virtualization management, service discovery, APM, topology, and CMDB tools (Datadog, Dynatrace, ServiceNow, and VMware vCenter) to create a full-stack, up-to-date model that enriches BigPanda alerts. Customers can also create custom enrichment integrations.
This section reviews which maps (tables) the organizations uploaded to enrich their data. The organizations in this report uploaded 6,160 enrichment maps.
- Over a third (38%) of organizations used a standard enrichment integration (Datadog, Dynatrace, ServiceNow, and/or VMware vCenter), and 78% of the enrichment maps came from standard integrations.
- The known data source with the most integrations was the ServiceNow CMDB (26%).
- Most enrichment maps came from the ServiceNow CMDB (42%) and Dynatrace (30%).
of the enrichment maps came from the ServiceNow CMDB
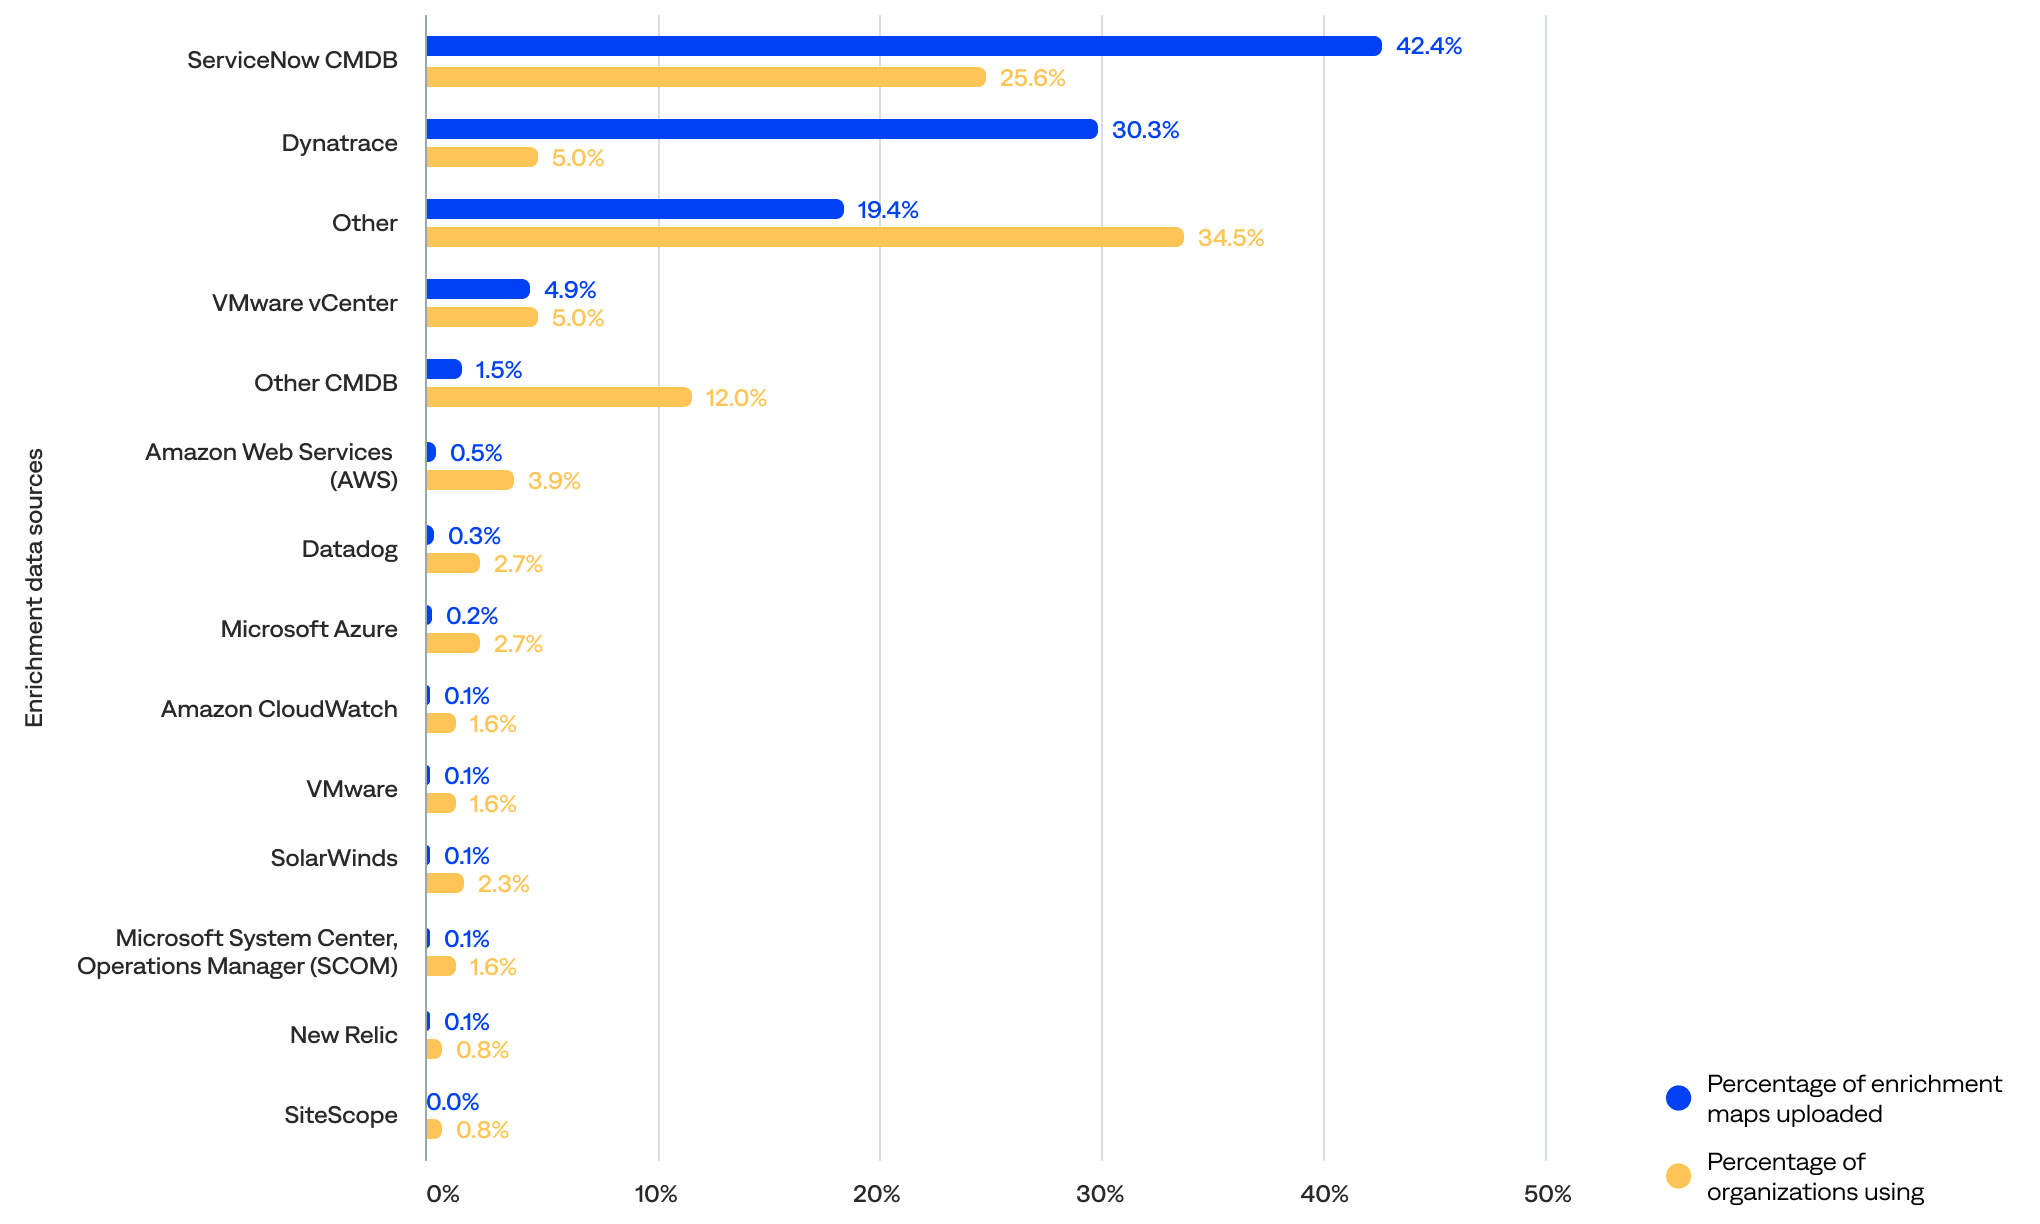


Percentage of enrichment maps uploaded and organizations using each enrichment data source
Enriched alerts
Nearly two-thirds (60%) of alerts were enriched for all incidents, and 77% were enriched for actioned incidents (mapping enrichment specifically). The median percentage of alerts enriched for all incidents per organization was 63%, and the median for all actioned incidents was 74%.
- The distribution is polarized, with about 20% of organizations either doing very little enrichment (0–10%) or achieving extremely high enrichment (90–100%). This suggests that organizations don’t gradually climb the enrichment ladder—they either commit fully or stay minimal.
- Nearly two-thirds (60%) had enriched at least 50% of their alerts, including 35% that had enriched at least 75% and 17% that had enriched at least 90%.
- Only 20% had enriched less than 10% of their alerts, including 9% that did not enrich alerts. This could represent onboarding organizations or organizations in the early stages of observability maturity.
of alerts were enriched for all incidents
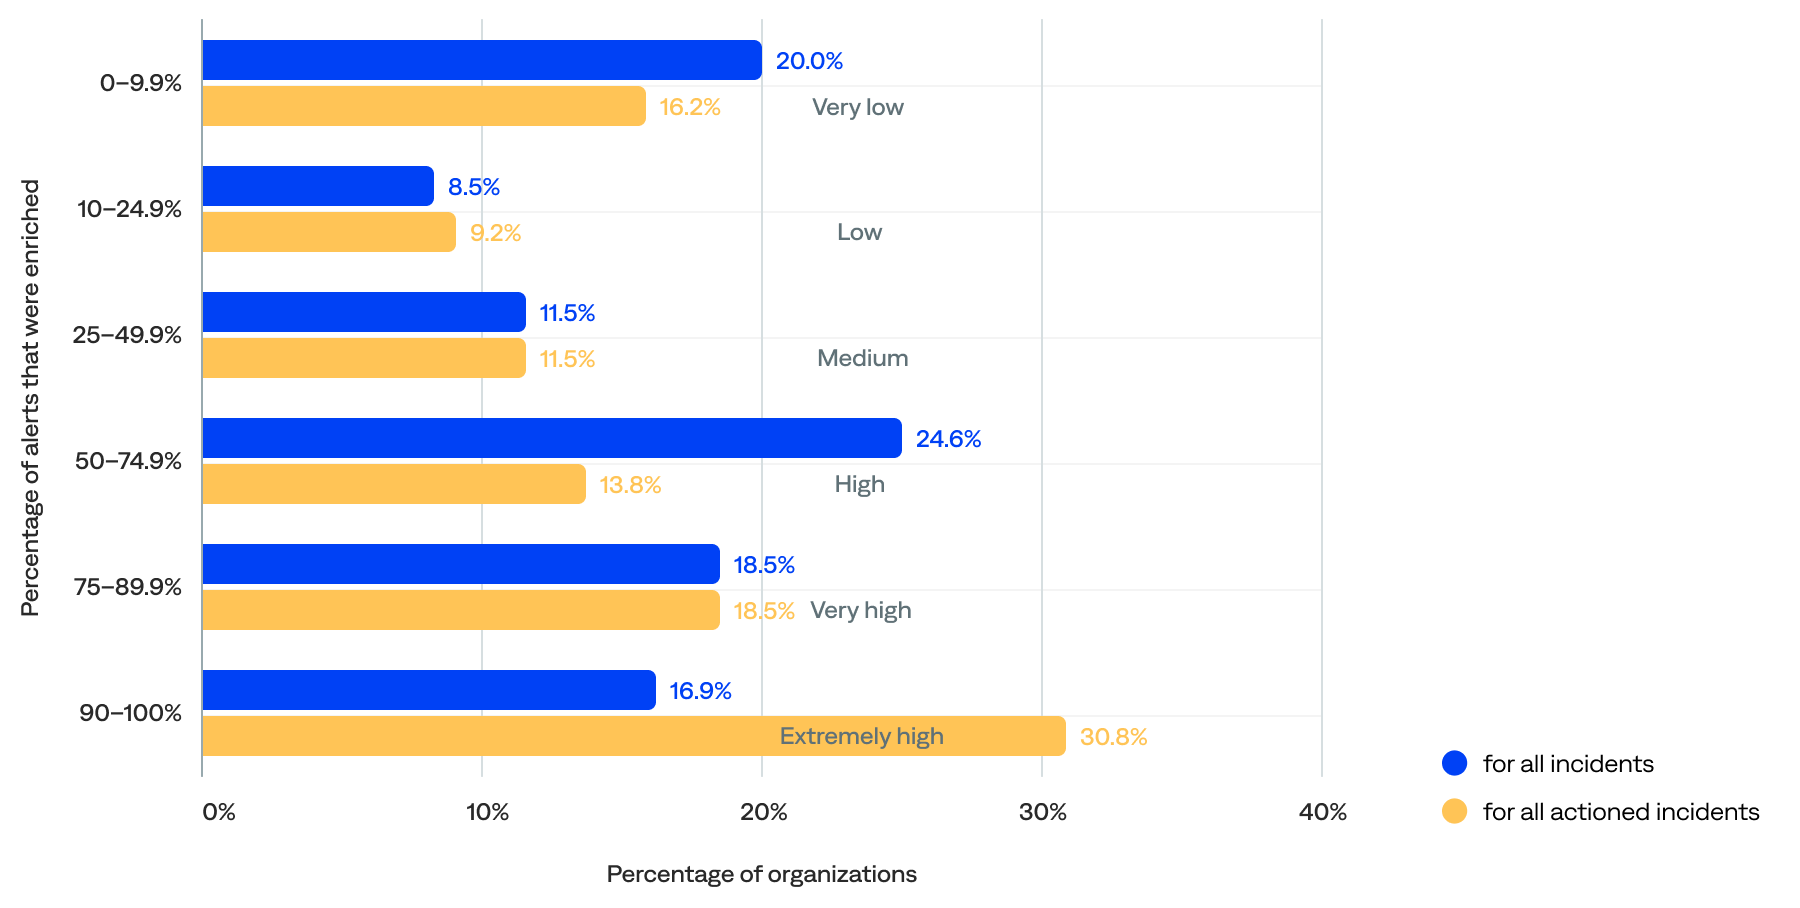
Percentage of alerts that were enriched for all incidents and all actioned incidents per organization
Alert correlation patterns
Correlation patterns set rules to define relationships between system elements, which BigPanda then uses to cluster alerts into incidents dynamically. They define the relationships between alerts using parameters, including the source system, tags, the time window, and an optional filter.
Teams can customize alert correlation patterns to align with the specifics of their infrastructure. They can also enable cross-source correlation, which correlates alerts from different source systems into the same incident.
Correlation patterns are easy to configure in BigPanda. In fact, all organizations had configured correlation patterns. There were 2,723 active correlation patterns, with a median of 14 per organization.
of organizations had 10+ active alert correlation patterns
- Nearly two-thirds (63%) of organizations had 10 or more active correlation patterns configured, including 40% with 20 or more.
- The industries with the highest median active correlation patterns configured were transportation (41), energy/utilities (32), and media/entertainment (26). Those with the lowest were telecommunications (9), MSPs (10), and manufacturing (10).
- Most (92%) correlation patterns were non-system-generated.
- Over half (52%) of all active correlation patterns had cross-source correlation enabled.
- Over half (53%) had correlation patterns with one tag, 30% had two tags, and 17% had three or more tags.
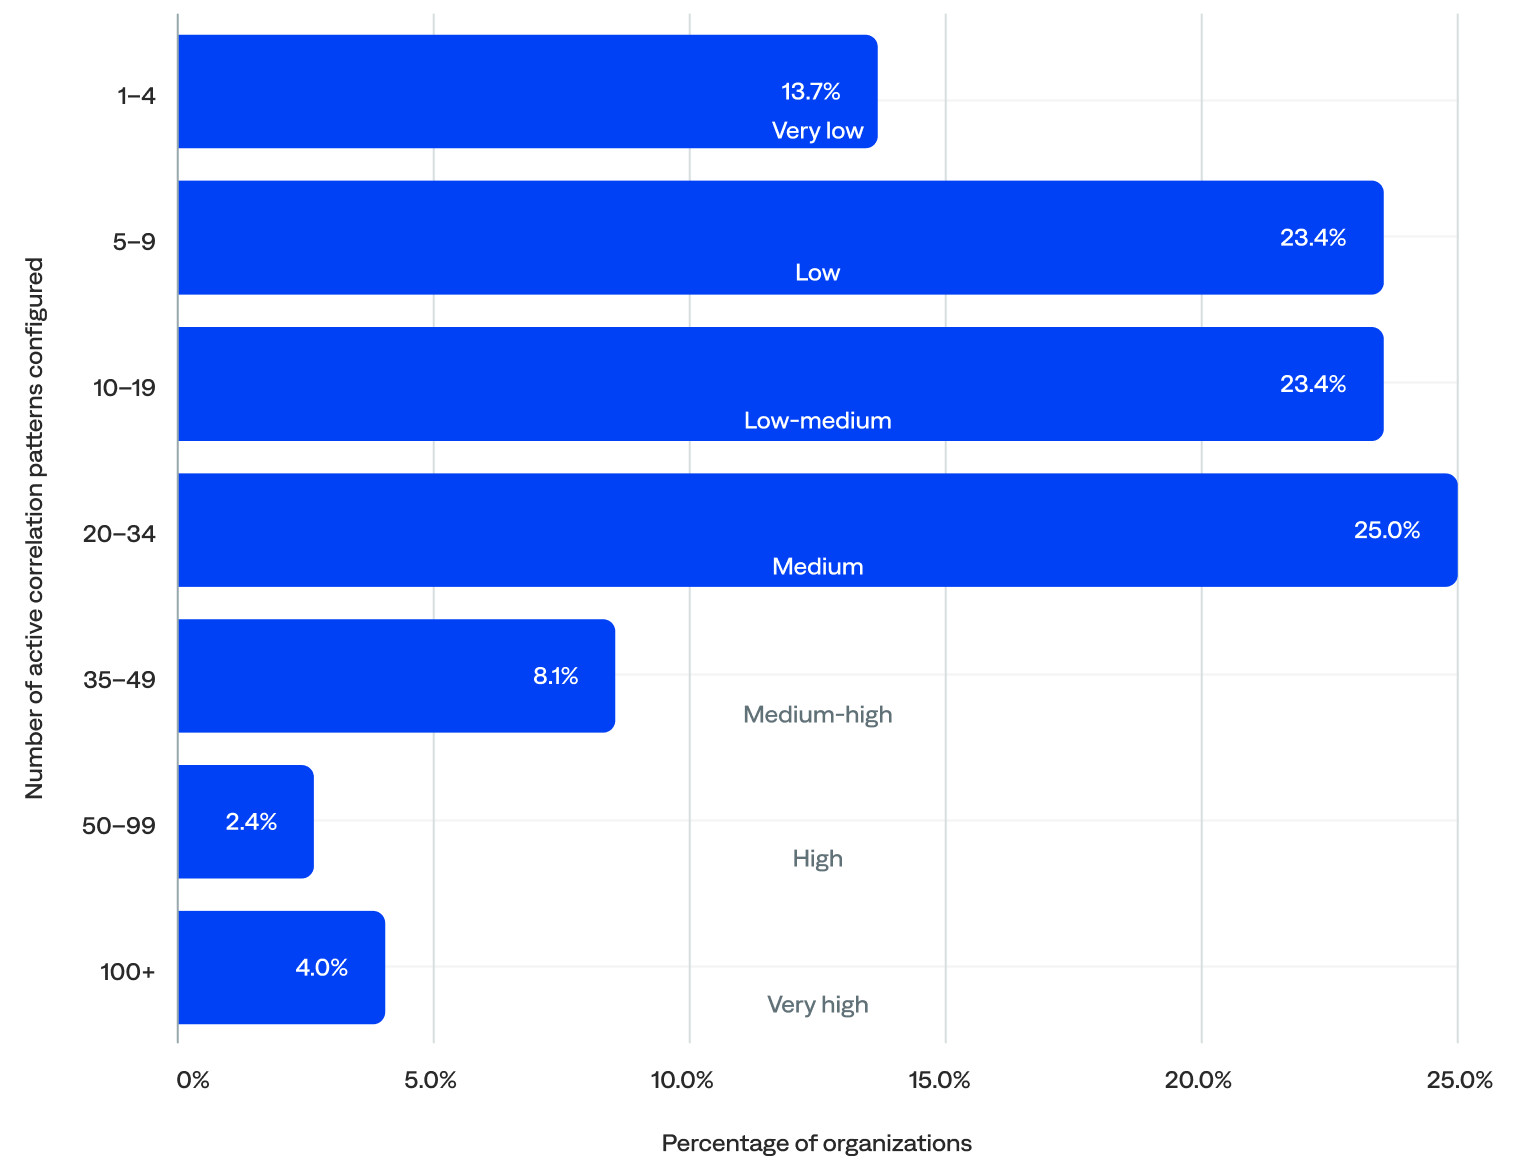
Percentage of active correlation patterns configured per organization (n=124)
“Not only can we see the alerts, but we can evaluate them using correlation that recognizes patterns, connects alerts, and leads to fewer incidents.”
–Head of Automation and Monitoring, Telecommunications Enterprise
Incidents
An incident in BigPanda consists of correlated alerts that require attention, such as an outage, performance issue, or service degradation.
As raw data is ingested into BigPanda from integrated tools, the platform correlates related alerts into high-level incidents. Incidents in BigPanda provide context to issues and enable teams to identify, triage, and respond to problems quickly before they become severe.
BigPanda consolidates event data from various sources into a single pane of glass for insights into multi-source incident alerts and the IT environment’s overall health. This enables ITOps, incident management, and SRE teams to investigate and analyze incidents, determine their root cause, and take action easily—all from one screen.
The lifecycle of an incident is defined by the lifecycle of the alerts it contains. An incident remains active if at least one of the alerts is active. BigPanda automatically resolves an incident when all its related alerts are resolved and reopens an incident when a related resolved alert becomes active again.
This section reviews the incident volume, the ratio of alerts correlated into incidents, the ratio of events compressed into incidents, and the environments per organization.
Key incident highlights:
Incident volume
This section reviews the annual incident volume, the annual incident volume by industry, and the daily incident volume for the organizations included in this report.
Annual incident volume
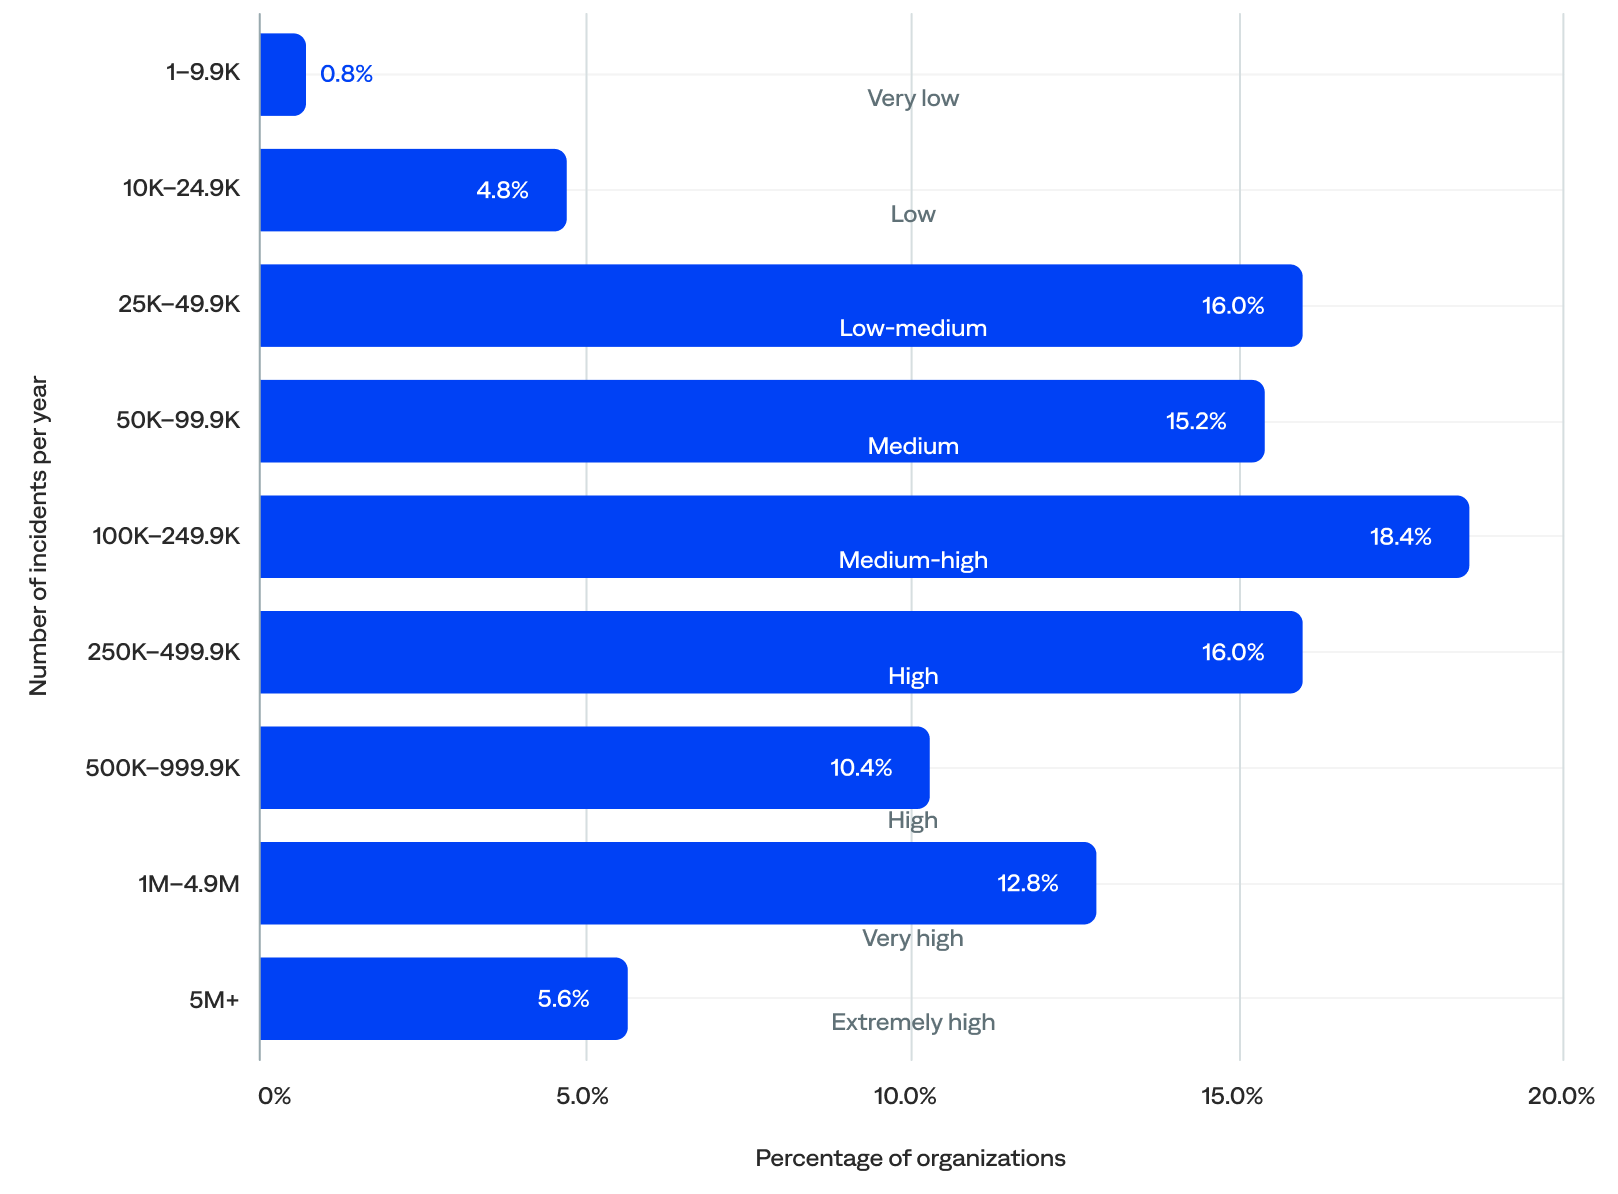
BigPanda generated nearly 132 million incidents in 2024, or over 131 million incidents per year after filtering out the five event outliers. The median was 177,949 incidents per year per organization.
-
- Over three-quarters (76%) of organizations experienced between 25,000 and 1 million incidents per year (low-medium to high annual incident volume), which indicates that most were actively using the platform to manage meaningful incident flow.
- Nearly two-thirds (63%) experienced at least 100,000 incidents per year.
- Almost half (45%) experienced 250,000 or more incidents per year (high to extremely high), including a small but meaningful group (18%) that experienced 1 million or more (very high to extremely high annual incident volume).
- Over a quarter (26%) experienced 250,000 to 1 million incidents per year (high annual incident volume), the largest group.
- Just 6% experienced fewer than 25,000 incidents per year (low to very low annual incident volume), likely onboarding organizations.
of organizations experienced 250K+ incidents per year
Annual incident volume (n=125)
Annual incident volume by industry
Looking at the median annual incident volume per organization by industry, the data showed that:
- Transportation organizations experienced the most annual incidents (1,199,234), followed by hospitality (711,851), telecommunications (629,295), energy/utilities (572,142), and financial services (400,824).
- Excluding the other industry category, managed service provider organizations experienced the fewest annual incidents (79,011), followed by media/entertainment (98,431), insurance (119,607), retail (123,619), and manufacturing (152,107).
Comparing the median to the mean (average) shows that:
- Financial services and insurance organizations had the biggest drops from mean to median, suggesting their means were very inflated by outliers. These organizations were likely highly variable, from niche players to massive global banks and insurers.
- The median incidents for transportation, hospitality, and energy/utilities organizations were notably higher than the mean. This suggests these sectors had more consistent usage across organizations and operated at scale (not just a few big players).
- The median incidents for telecommunications and managed service provider organizations were much lower than the mean, hinting at a heavy skew from a few power users.
- The median healthcare, technology, and media/entertainment organization incidents were relatively close, indicating uniform adoption patterns and more stability.
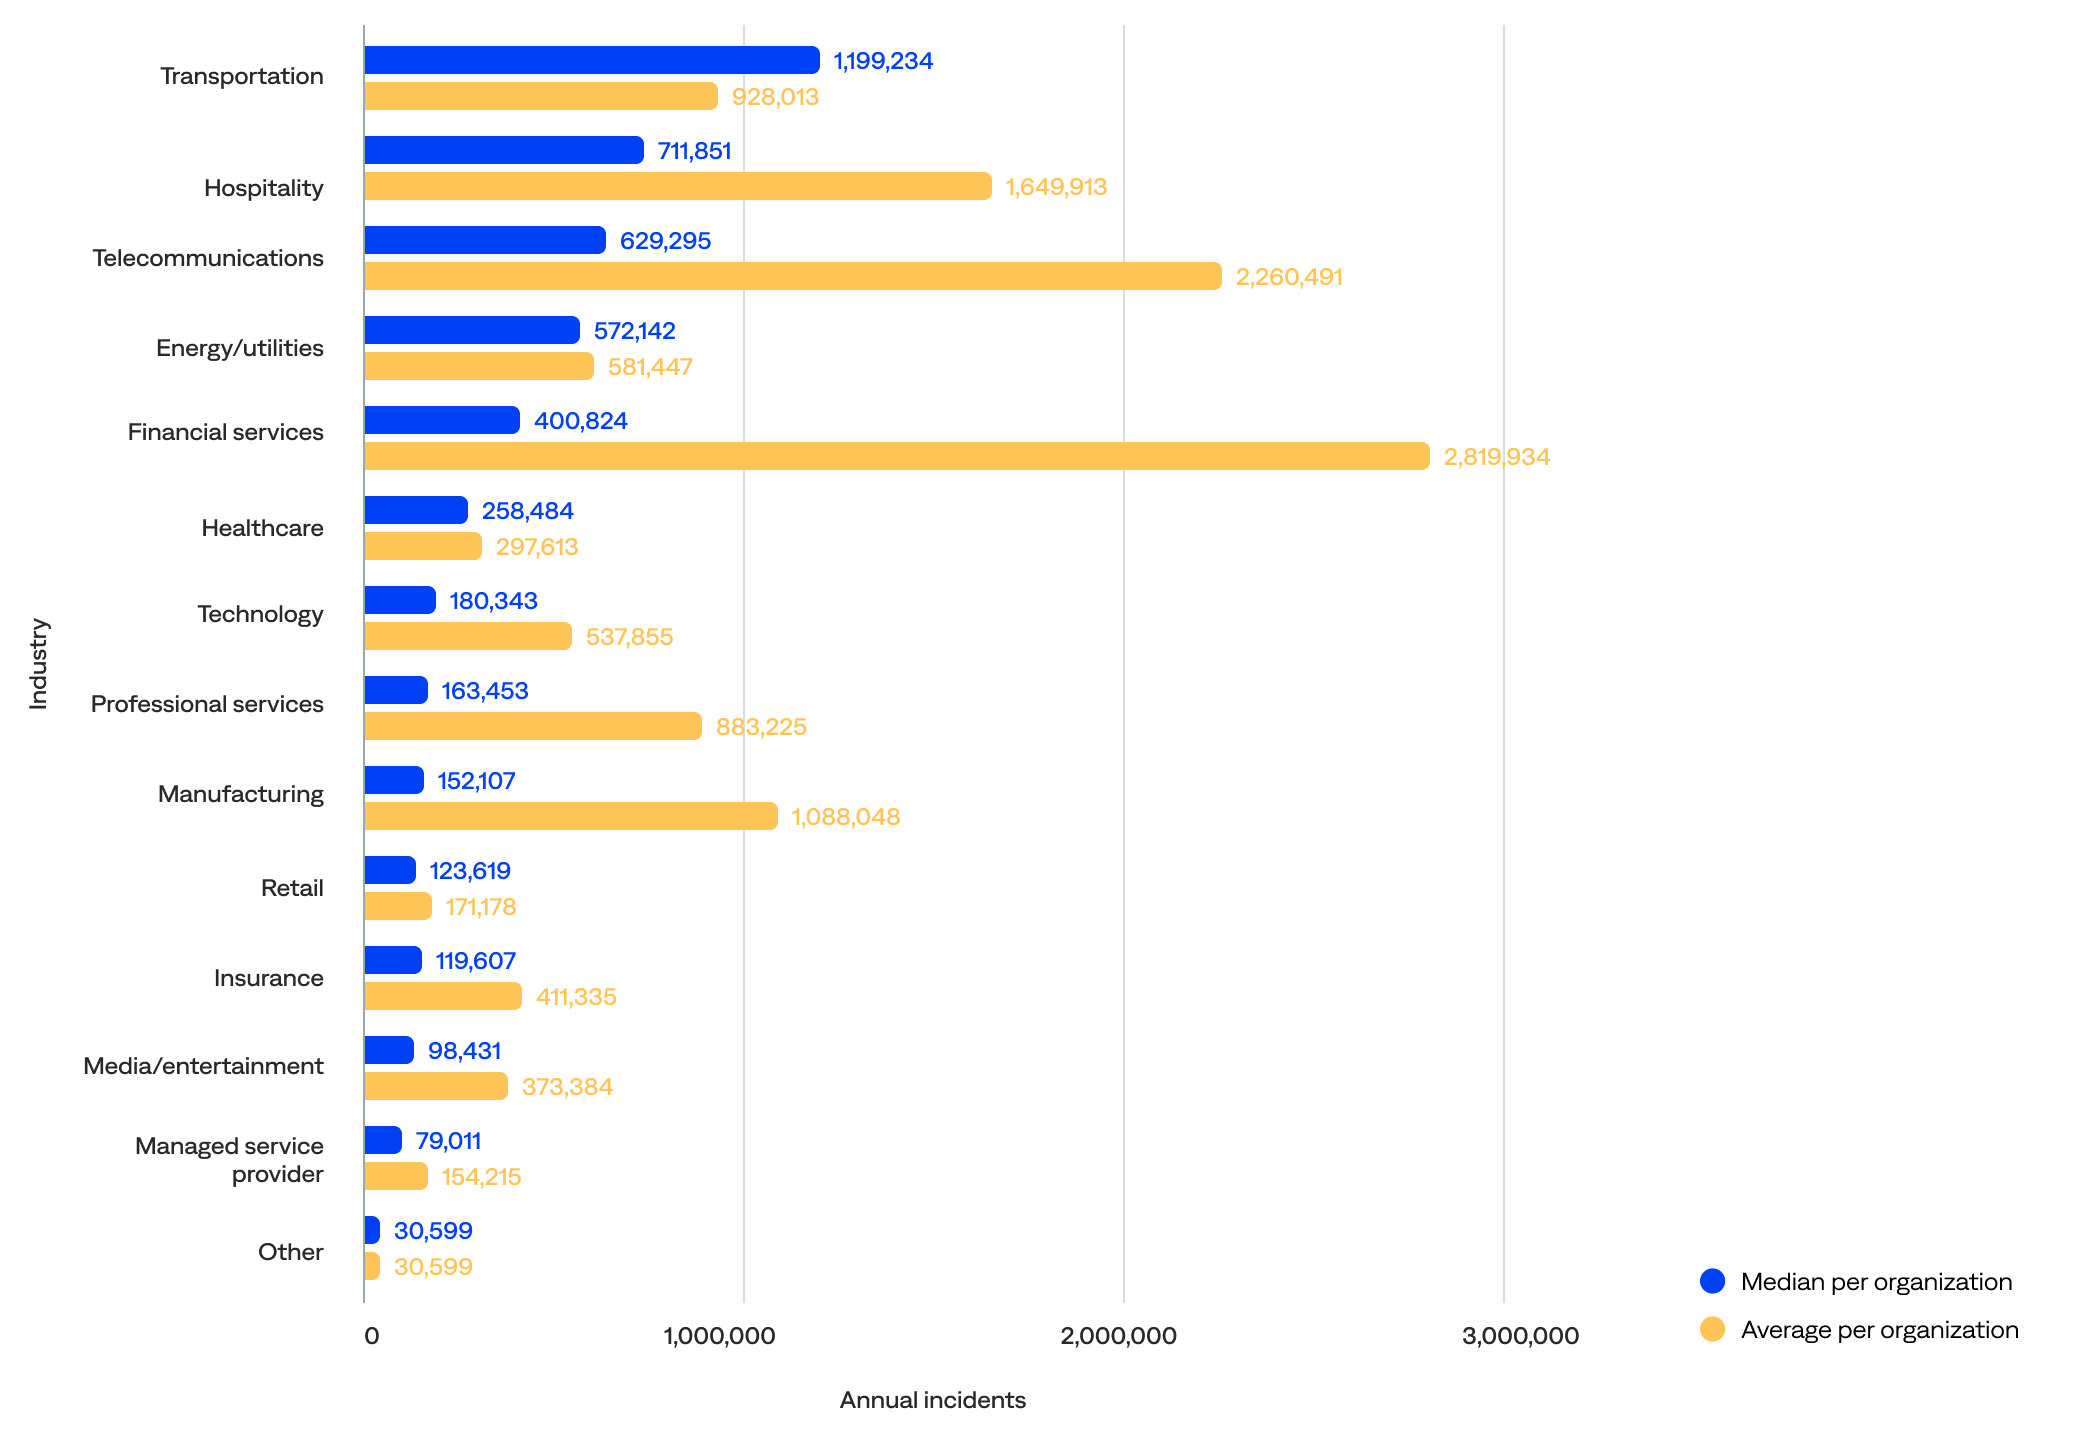
Median and average annual incident volume per organization by industry (n=125)
Daily incident volume
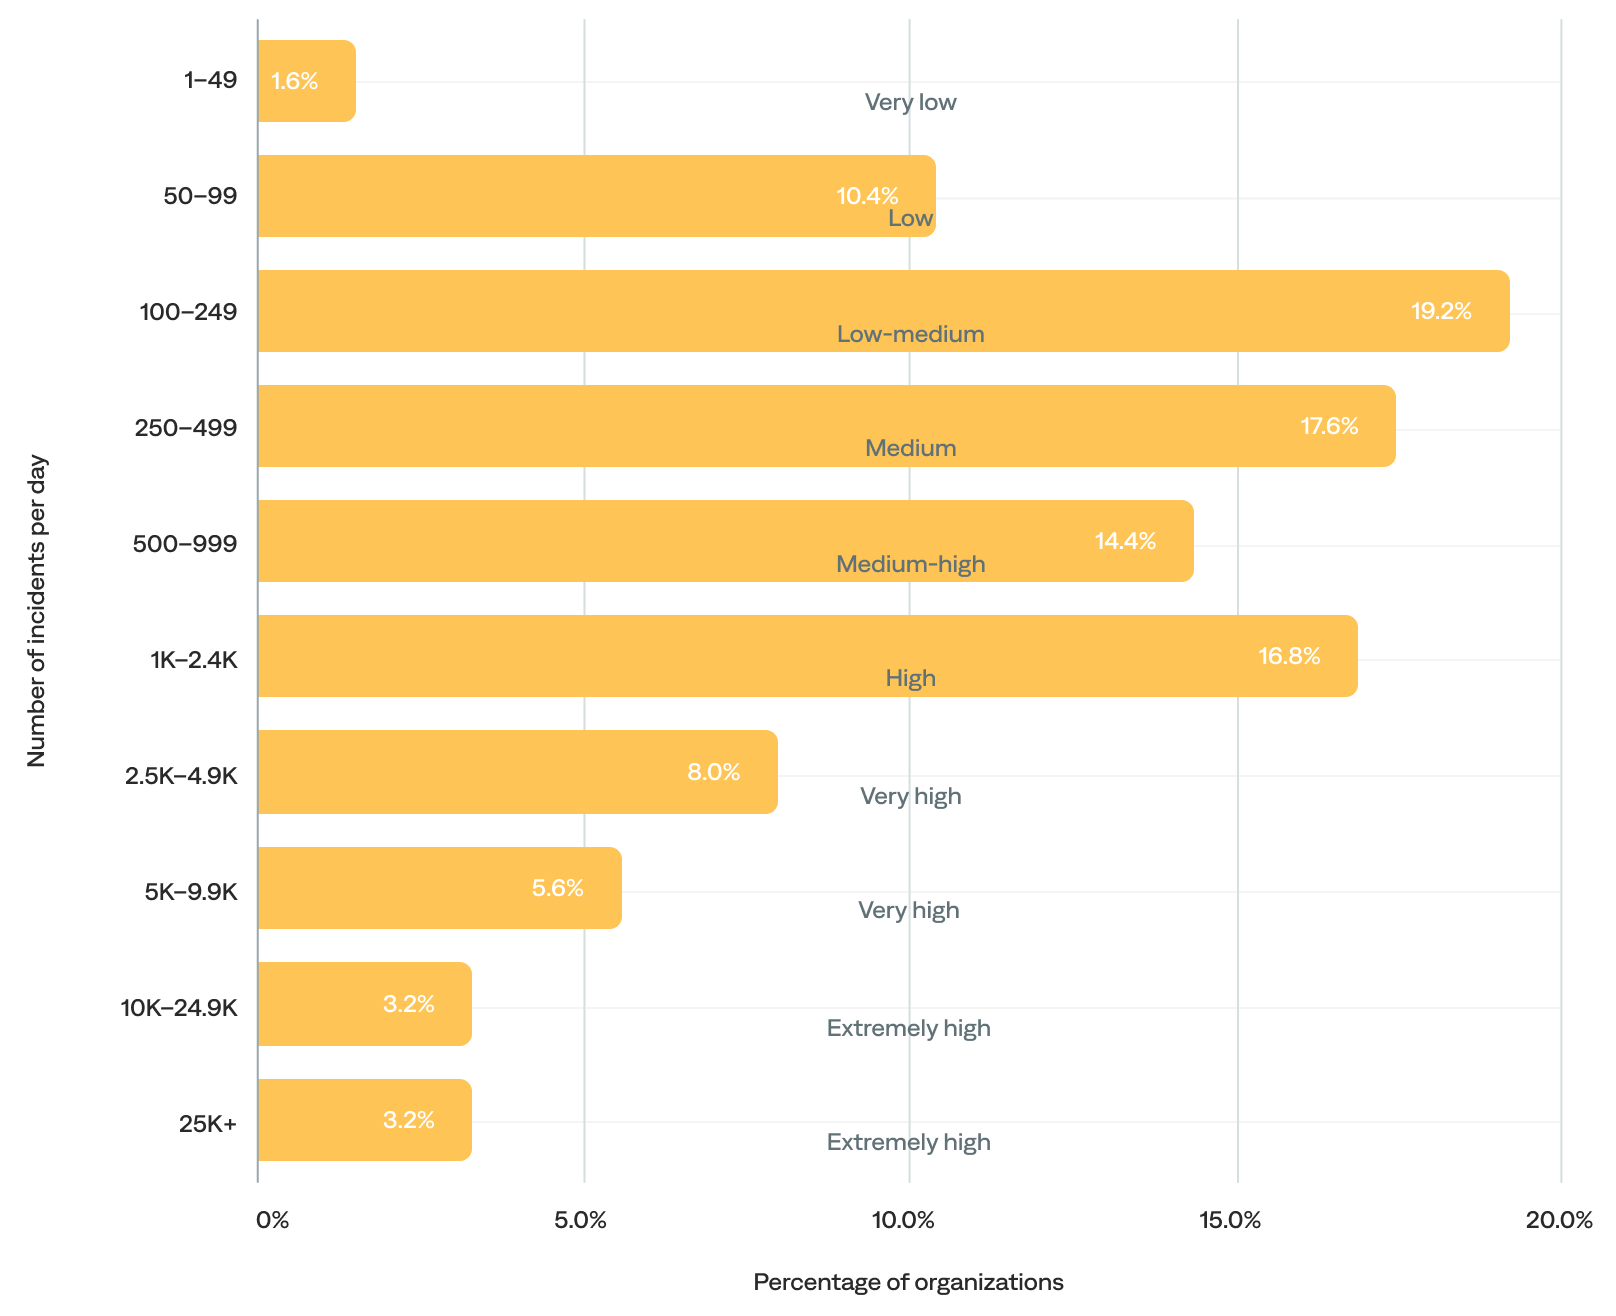
The median daily incident volume was 545 incidents per day. After excluding the 3% of organizations with more than 25,000 incidents per day (outliers), the median barely shifts (from 545 to 494), reinforcing that most organizations remain in the low-to-medium range.
- Over half (51%) of organizations generated 100–999 daily incidents (low-medium, medium, and medium-high daily incident volume). In other words, most organizations experienced fewer than 1,000 incidents per day.
- Over a third (37%) experienced 1,000 or more daily incidents (high-to-extremely-high daily incident volume).
- The remaining 12% experienced fewer than 100 incidents per day (very-low-to-low daily incident volume), likely including onboarding organizations.
of organizations experienced 500+ incidents per day
Daily incident volume (n=125)
Alert correlation rate
Alert correlation, also known as event correlation, uses correlation patterns to consolidate alerts from external observability and monitoring tools, significantly reducing alert noise and giving teams actionable insights to resolve incidents before they become outages. The alert-to-incident correlation rate is the percentage of alerts correlated into incidents.
A healthy alert-to-incident correlation rate range is 40–75%. Anything under 40% usually leaves something on the table; anything over 75% usually means too much correlation. It’s a delicate balance.
The median alert-to-incident correlation rate was 67%.
- About half (49%) had a healthy alert-to-incident correlation rate (40–75%).
- Over a third (38%) had a high alert-to-incident correlation rate (75% or more).
- Only 14% had a low alert-to-incident correlation rate (less than 40%).
of organizations had a healthy alert correlation rate (40–75%)
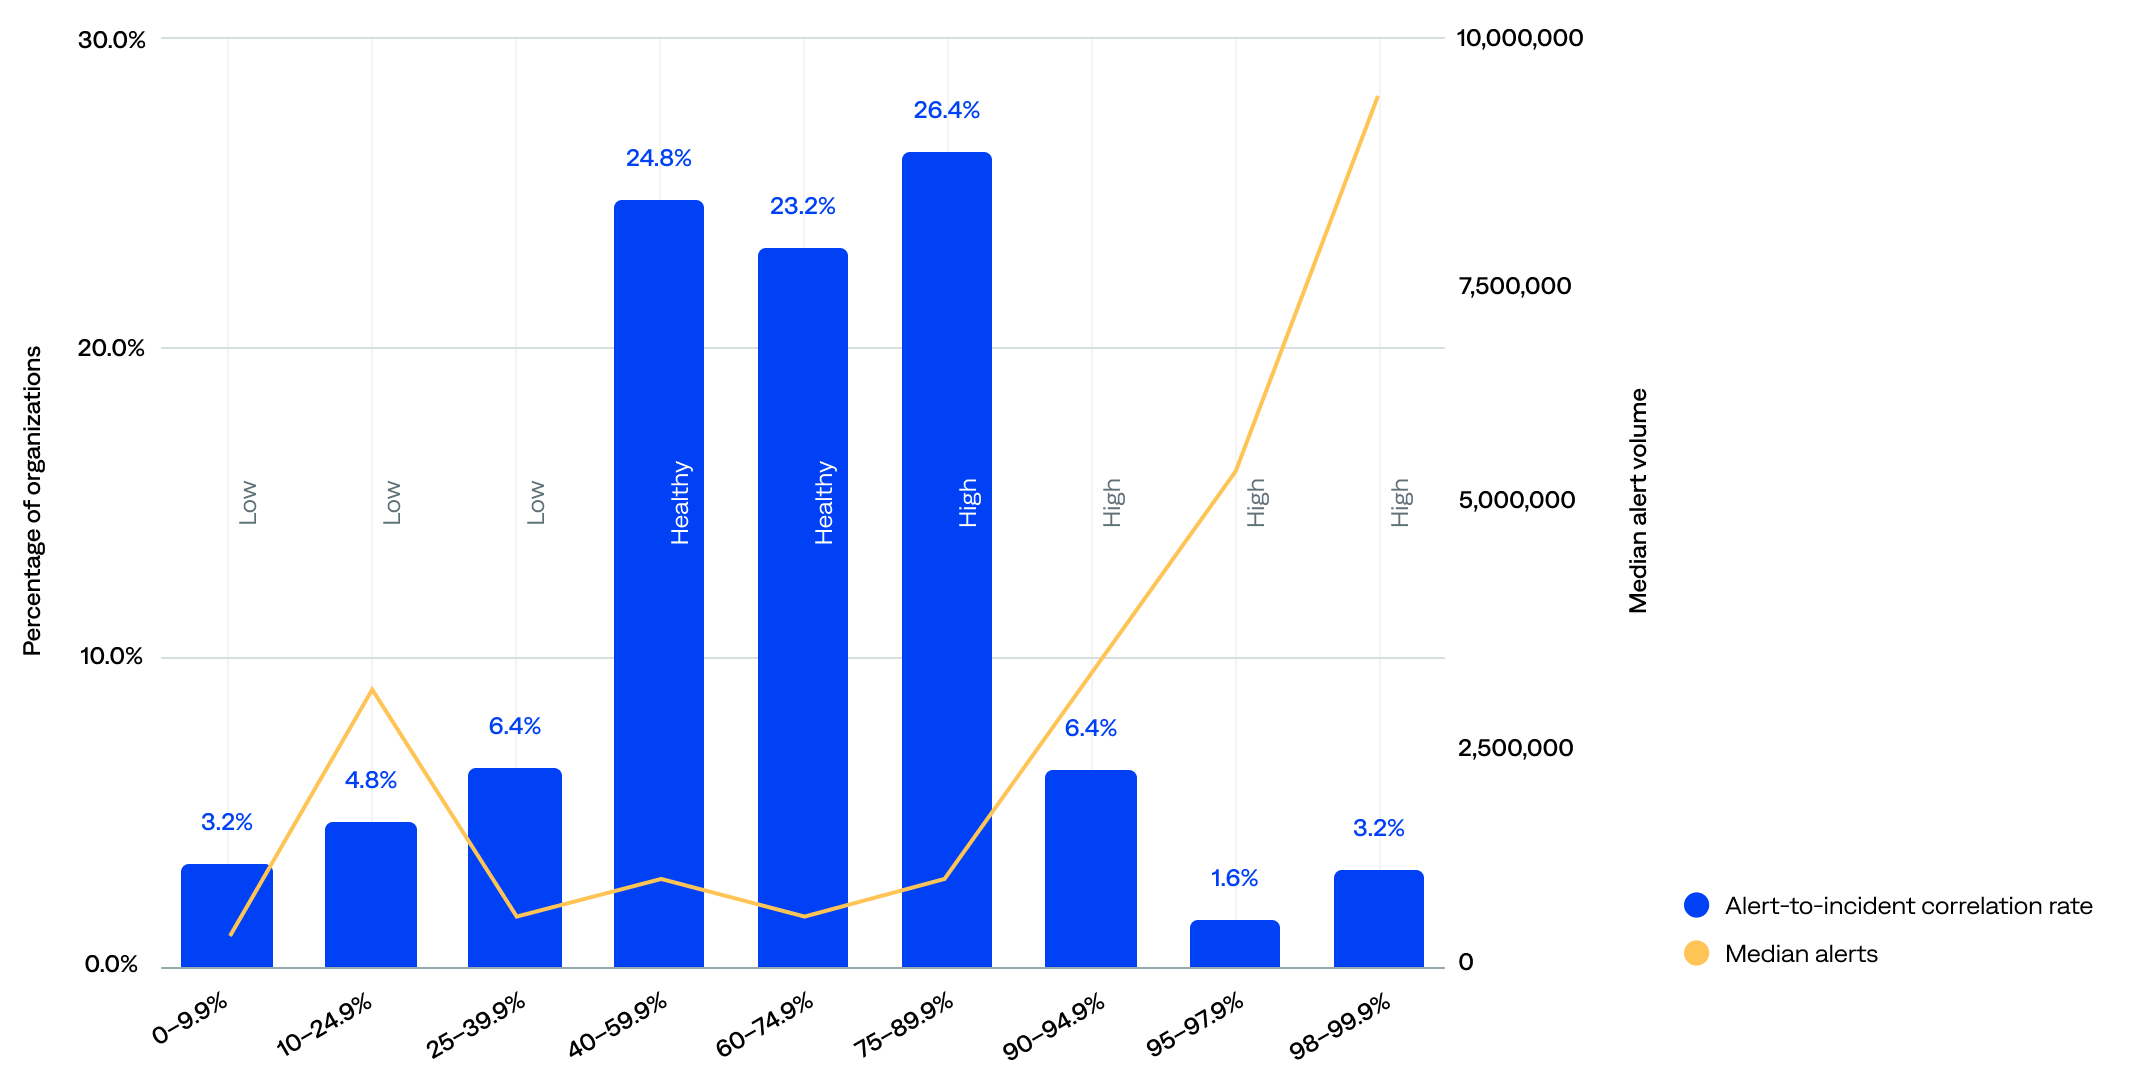
Alert-to-incident compression rate compared to median event volume (n=125)
The data show that alert volume alone does not determine correlation efficiency. Still, there’s a mild tendency for organizations with a high volume of alerts to achieve better correlation, likely due to operational scale.
Incident compression rate
The incident compression rate, sometimes called just compression or compression rate, is the percentage of events compressed into incidents (event-to-incident compression rate).
The event-to-incident compression rate ranged from 70.9% to 99.9%, and the median was 97.3%.
- Most (72%) organizations achieved a strong event-to-incident compression rate of 95% or more—including 30% with a very high rate of 98.5% or more—signaling that event deduplication and correlation work well for the majority.
- One in five (20%) had high event volumes and respectable (medium) compression rate of 85–94.9%, indicating they likely have strong rules but might benefit from fine-tuning.
- Only 8% had a very-low-to-low event-to-incident compression rate of below 85%. However, the 70–79.9% range, while tiny at just 4%, had a surprisingly high median event volume, suggesting missed correlation opportunities, noisy environments, or onboarding organizations.
of organizations achieved a strong incident compression rate (95+%)
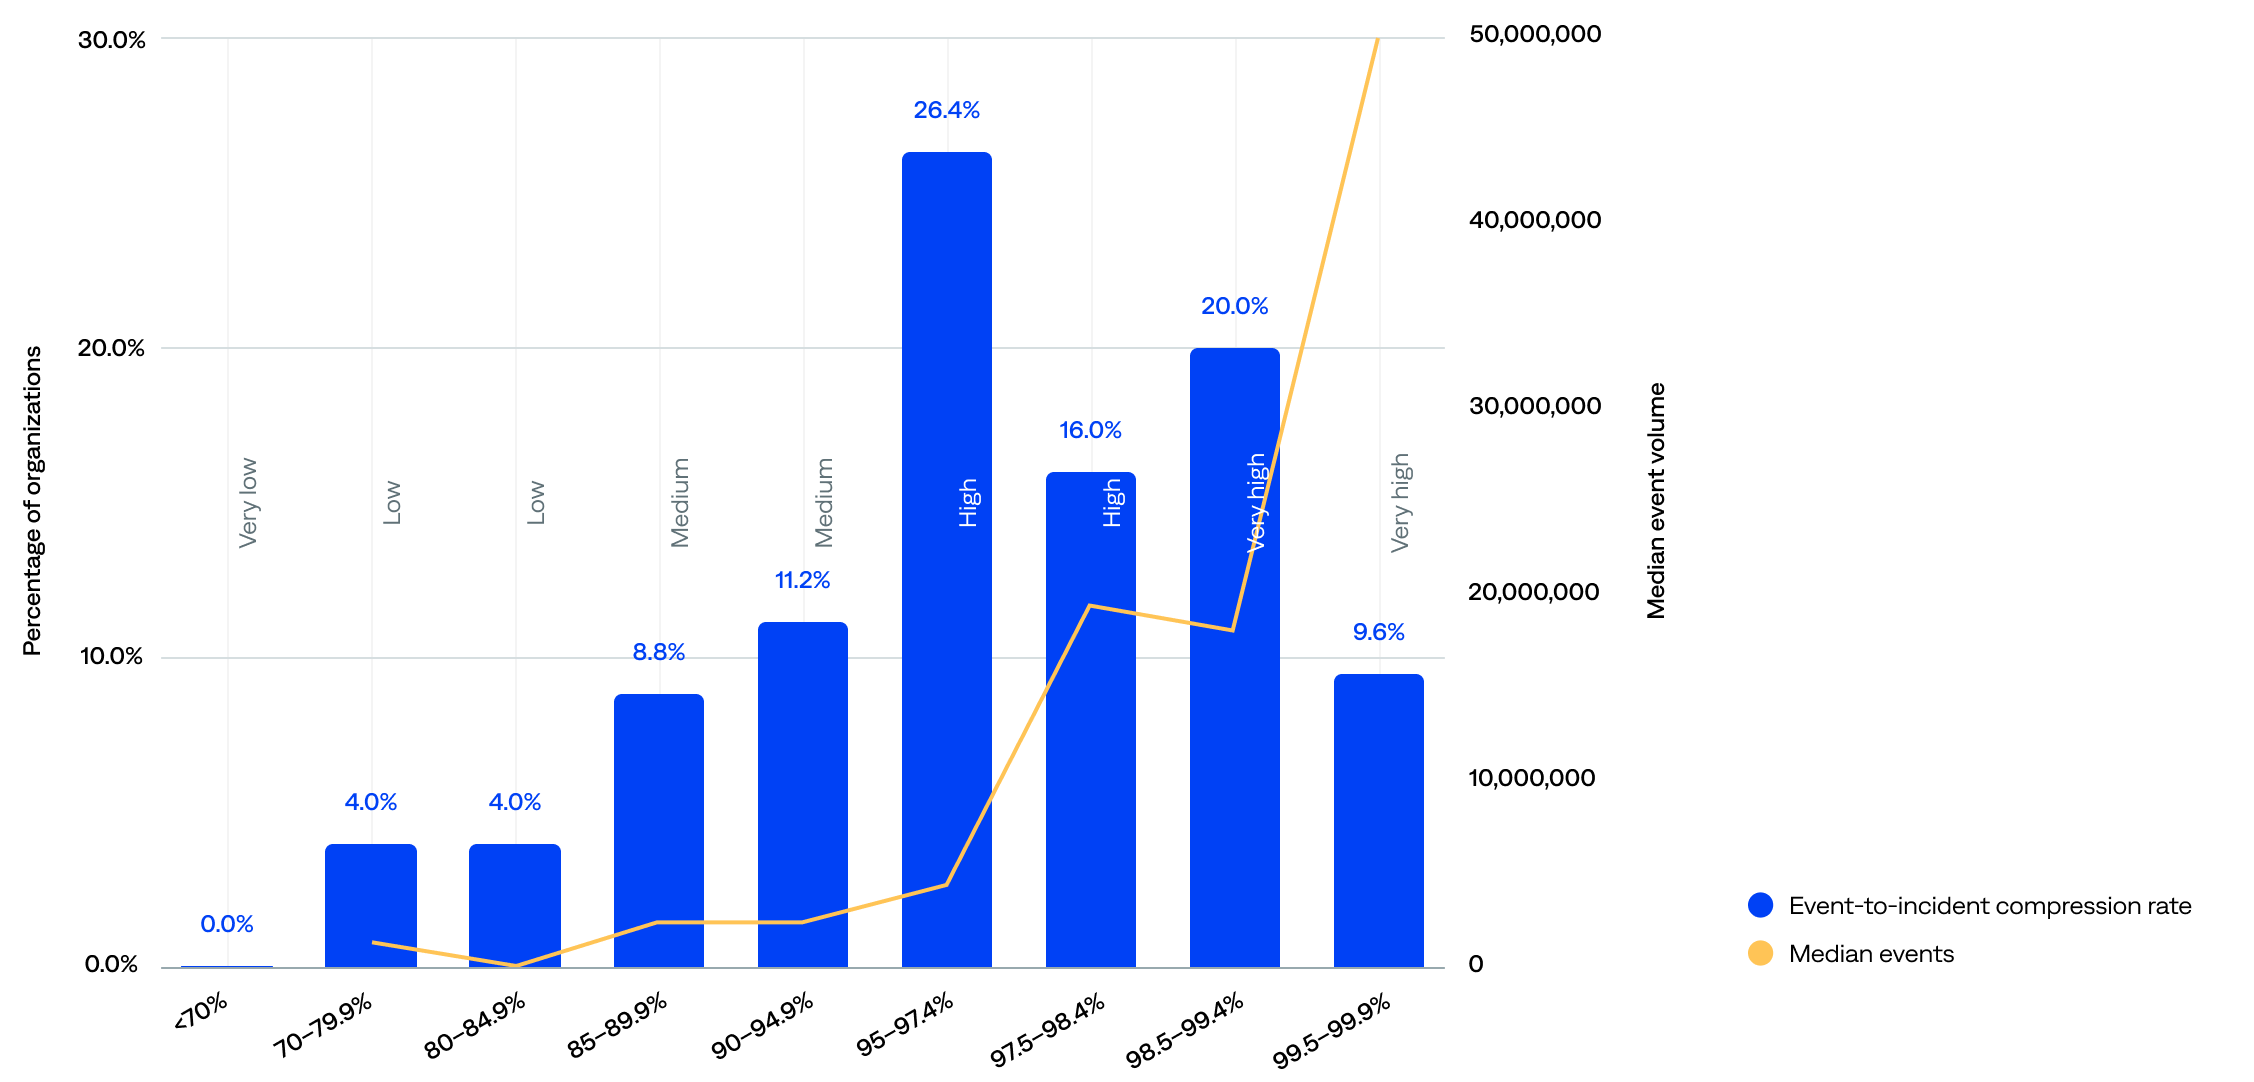
Event-to-incident compression rate compared to median event volume (n=125)
The median event volume did not always correlate with the compression rate range. For example, organizations in the 97.5–98.4% range compressed more efficiently than those in the 95–97.4% range, yet had a slightly lower event volume. This implies that compression quality is not solely a function of volume; configuration and filtering are likely key drivers.
Environments
In BigPanda, an environment is a configurable view of the IT infrastructure that helps teams focus on specific incident-related information.
Environments filter incidents on properties, such as source and priority, and group them for improved visibility, automation, and action. They are customizable and make it easy for teams to focus on incidents relevant to their role and responsibilities, including filtering the incident feed, creating live dashboards, setting up sharing rules, and simplifying incident searches.
Excluding the five outliers, the median number of environments per organization was 58.
- About three-quarters (74%) of organizations had 26–200 environments, including 34% with 51–100, the largest segment in the distribution. These organizations likely have multiple teams, applications, or regions that require centralized monitoring and incident response capabilities and are candidates for scaling observability and automation.
- Nearly one in five (19%) had 25 or fewer environments, including 4% with 10 or fewer. This may indicate they had simpler environments with fewer assets to monitor, were likely to rely on basic alerting or minimal automation, and had room to grow in segmentation, tagging, and response maturity.
- Just 6% had more than 200 environments. These organizations likely require deep observability, advanced correlation, enrichment, and deduplication, as well as multi-environment analytics and reporting.
of organizations had 50+ environments
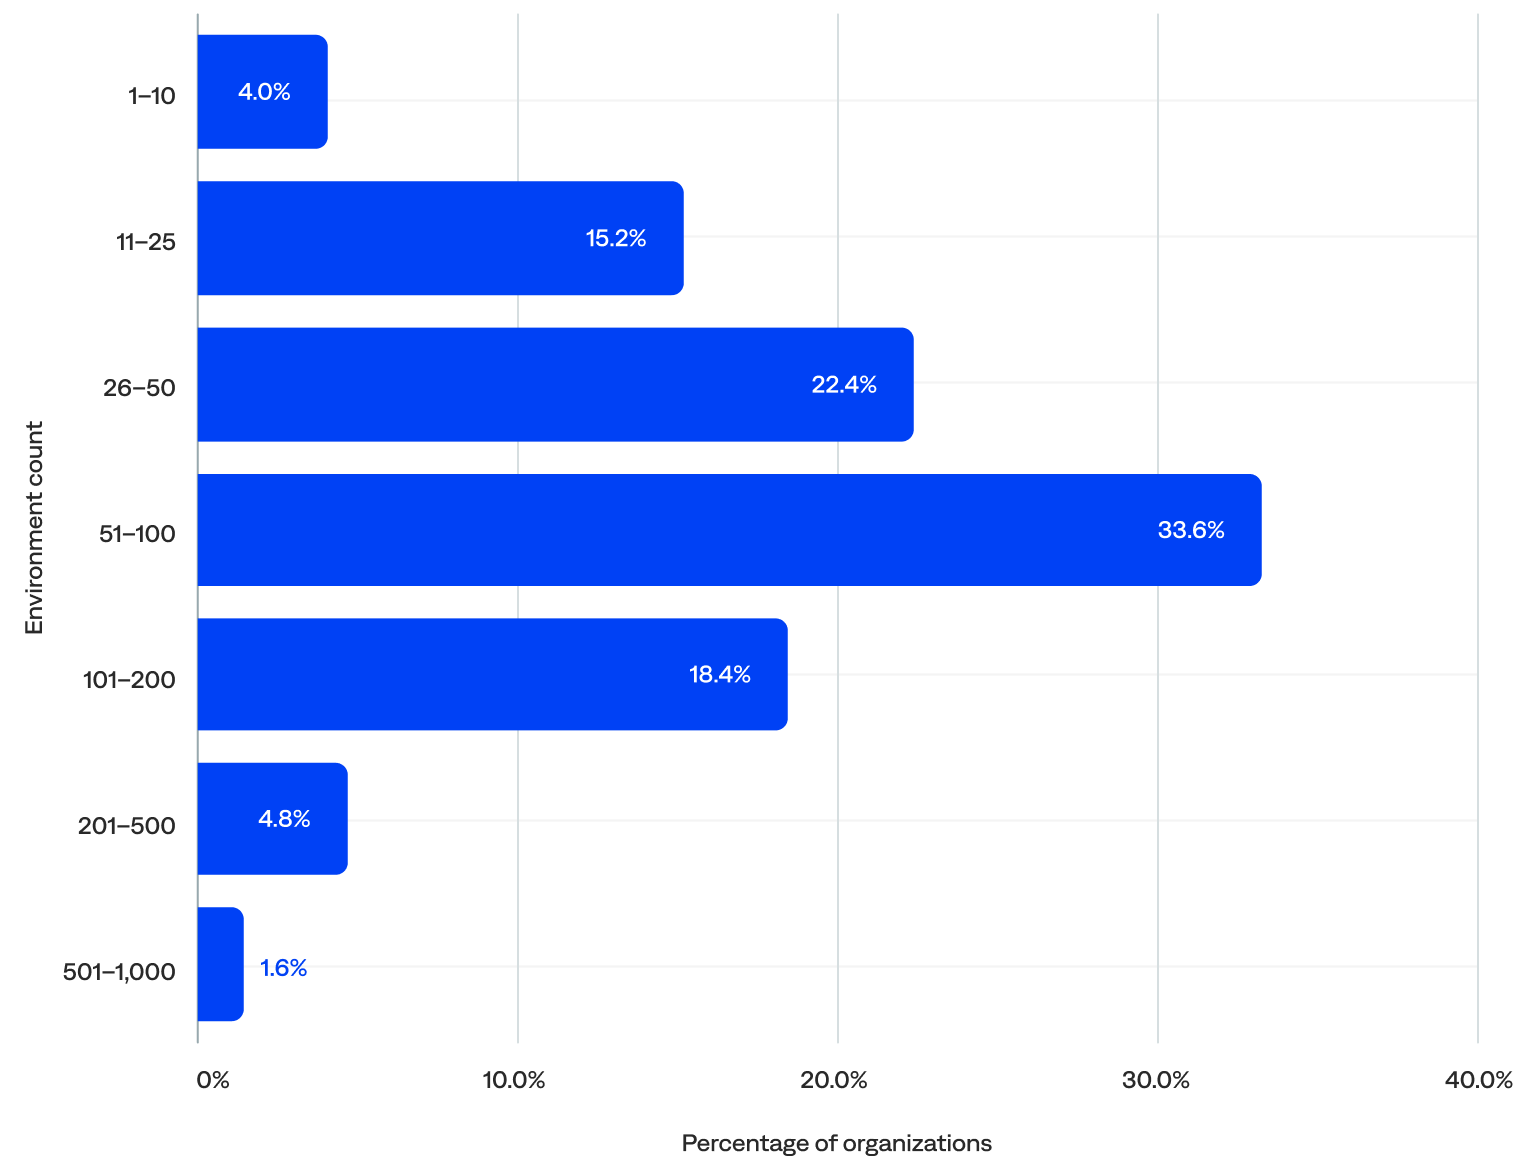
Number of environments per organization (n=125)
Actioned incidents
Actioned incidents represent outages and system issues that a team member acted on. An action could be a comment, an assignment to a user, a manual share, or an automated share. They are a key metric in determining the efficacy of BigPanda configuration and workflows.
This section reviews the incident volume, actionability rate (incident-to-actioned-incident rate), and noise reduction rate (event-to-actioned-incident rate).
Key actioned incident highlights:
“For us, an alert is not actionable unless it comes into BigPanda, is enriched, and is potentially correlated with the other alerts in the system.”
–Head of Software Engineering, Telecommunications Enterprise
Actioned incident volume
This section reviews the annual actioned incident volume, the annual actioned incident volume by industry, the monthly actioned incident volume, and the daily actioned incident volume.
Annual actioned incident volume
BigPanda generated nearly 20 million actioned incidents in 2024 for the organizations included in this report. After filtering out the five event outliers, there were 19.23 million actioned incidents per year. The median was 34,232 actioned incidents per year per organization.
- Two-thirds (66%) of organizations actioned 10,000–249,999 incidents per year (medium-to-high volume), suggesting widespread usage of the BigPanda platform at an operational scale. A third (33%) actioned 10,000–49,999 incidents per year (medium-to-medium-high volume), and the other third (33%) actioned 50,000–249,999 incidents per year (high volume).
- Nearly a quarter (23%) actioned fewer than 10,000 incidents per year (very-low-to-low-medium volume), including 6% with fewer than 1,000, which were likely onboarding organizations.
- Just 11% actioned 250,000 or more incidents per year (very-to-extremely-high volume), including 2% with 1 million or more, representing very large, global enterprises operating with complex business logic.
of organizations actioned 10K–49.9K annual incidents
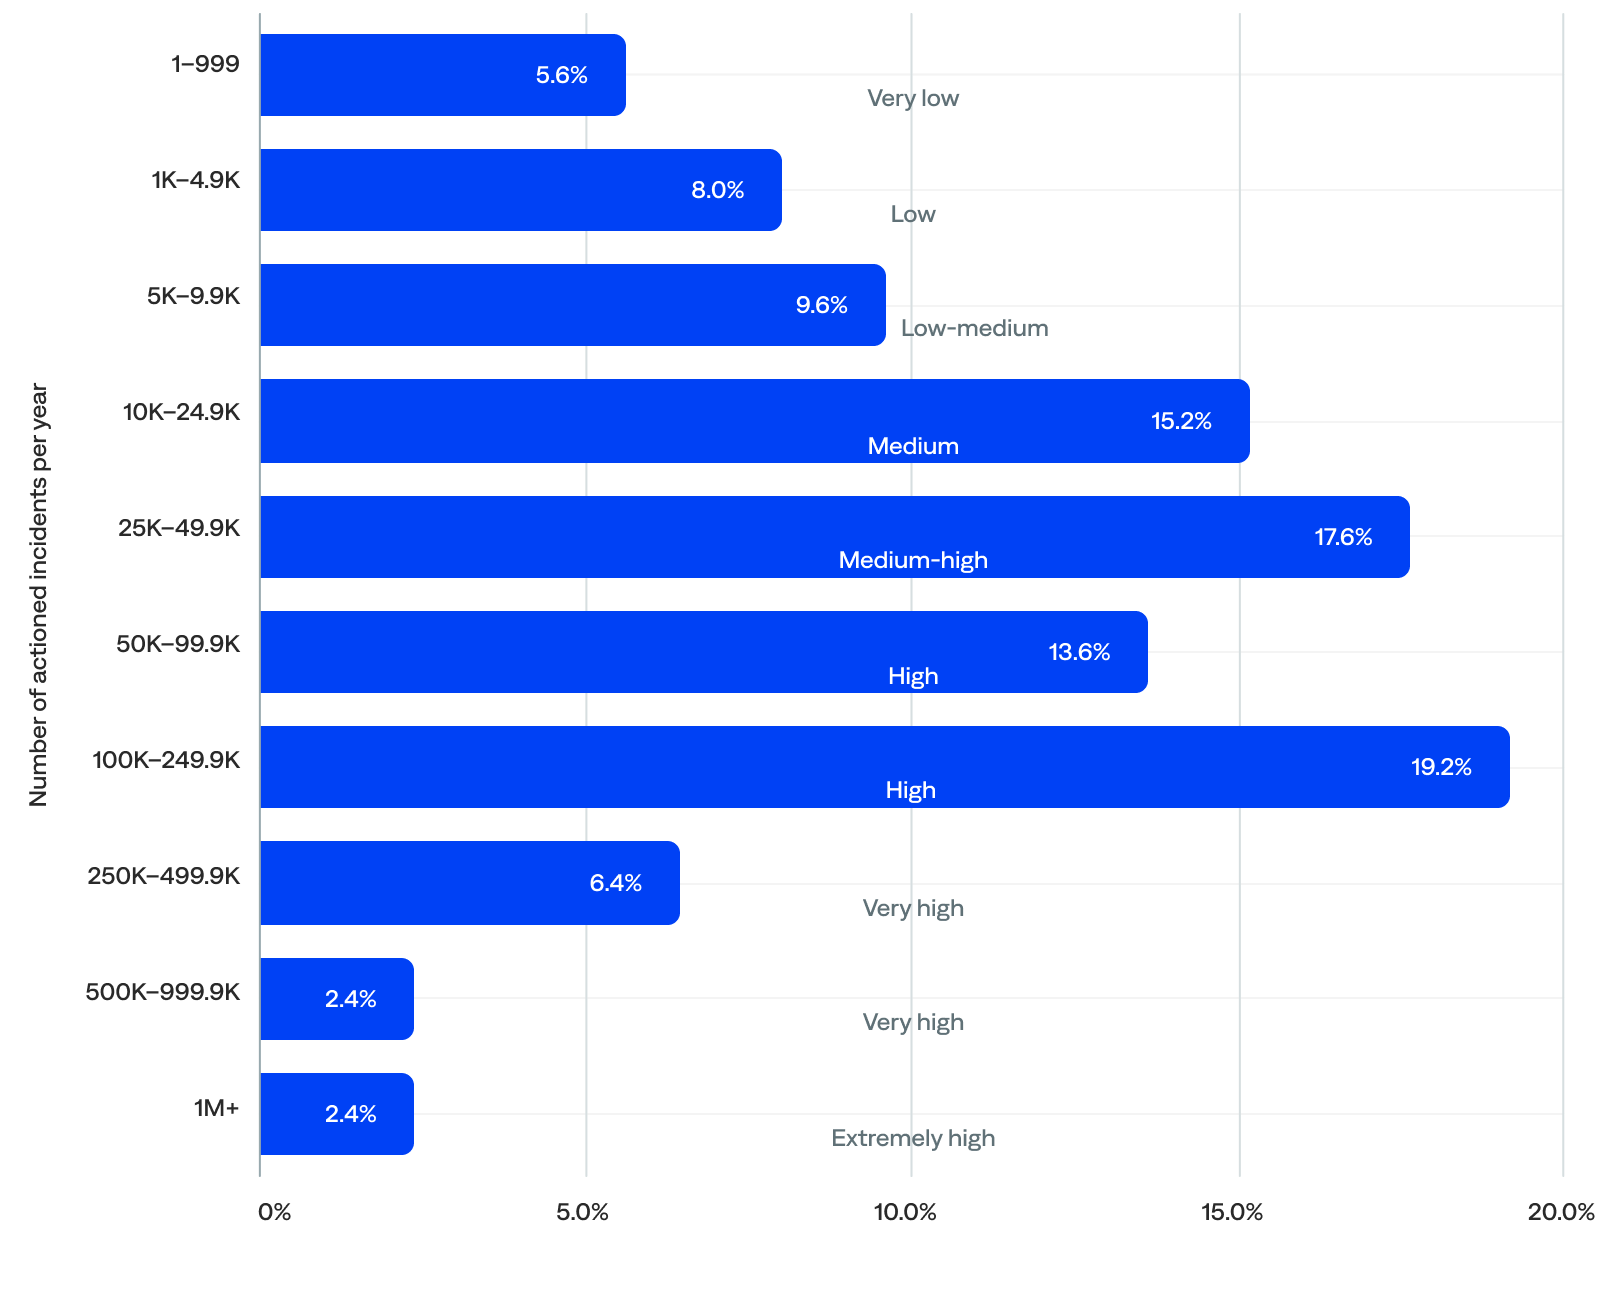
Annual actioned incident volume (n=125)
Annual actioned incident volume by industry
Looking at the median annual actioned incident volume per organization by industry, the data showed that:
- Transportation organizations actioned the most incidents per year (127,702), followed by hospitality (109,993), financial services (86,034), energy/utilities (54,460), and technology (46,856).
- Excluding the other industry category, professional services organizations actioned the fewest incidents per year (24,742), followed by healthcare (26,145), media/entertainment (29,368), managed service providers (31,977), and manufacturing (33,083).
Comparing the median to the mean (average) shows that:
- Financial services organizations had a significant gap between the mean (490,157) and median (86,034) actioned incidents per year, indicating a heavily skewed distribution likely driven by a few very large organizations and wide variability in scale within the sector.
- Transportation was the only industry where the median (127,702) exceeded the mean (121,876), implying that most transportation organizations had fairly consistent usage with a relatively balanced distribution and no extreme outliers.
- The technology and energy/utilities industries showed lower medians (46,856 and 54,460, respectively) than means (118,089 and 107,702, respectively), suggesting a few high-volume organizations lifted the average. Still, most organizations in these industries had lower volumes of actioned incidents.
- Hospitality industries had a high median (109,993) relative to their mean (193,082), indicating a more even usage distribution and leaning toward mature implementations across the organizations.

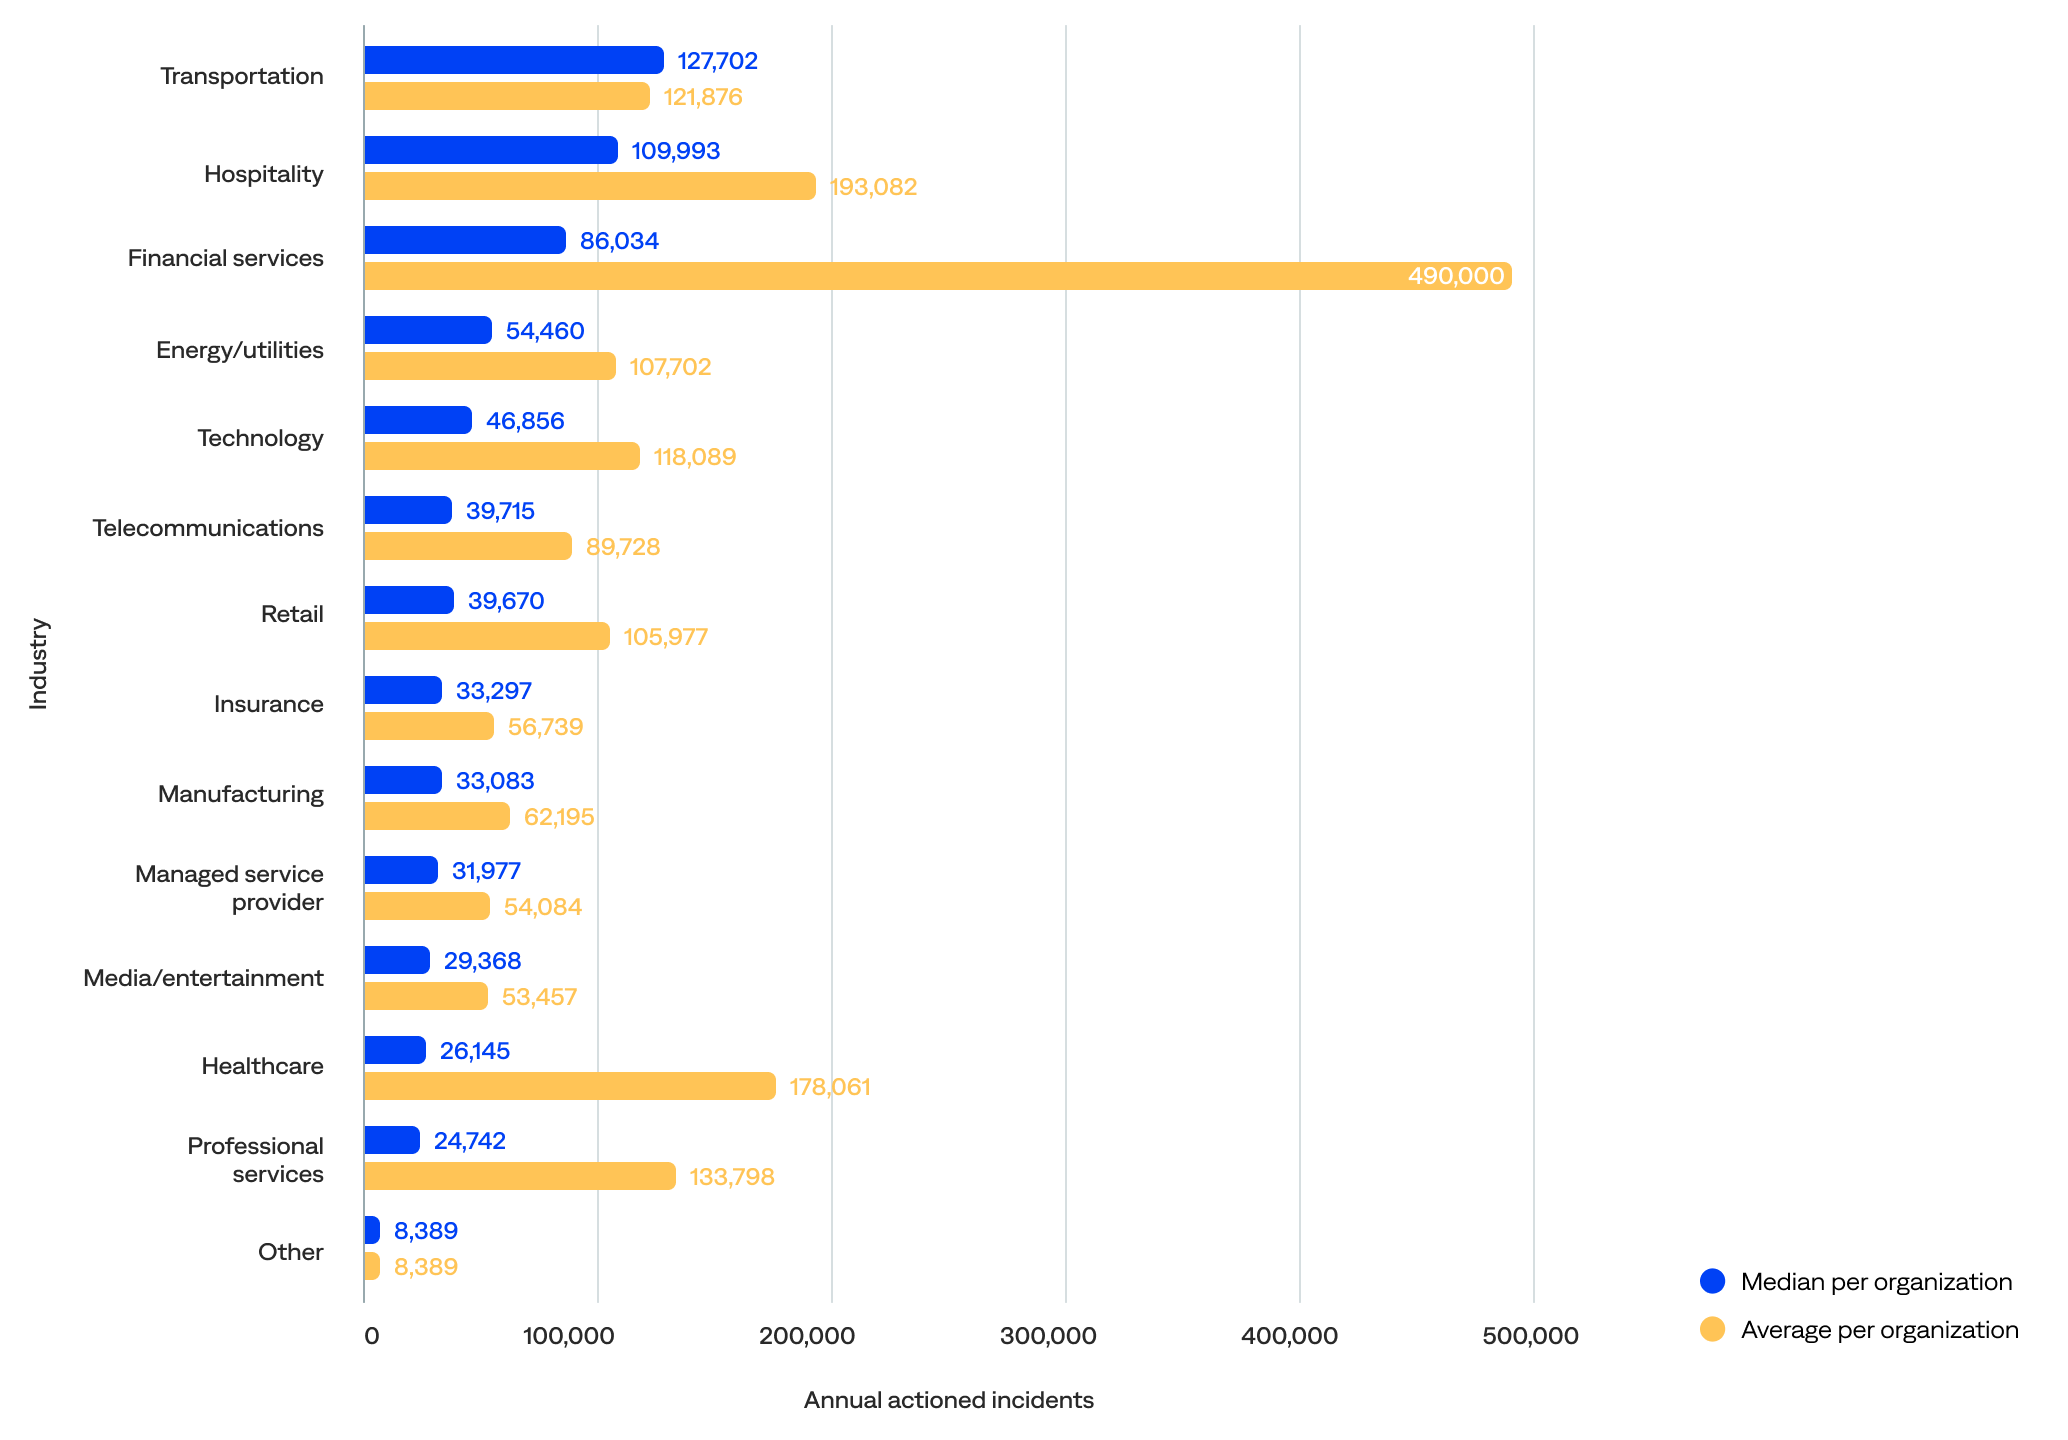
Median and average annual actioned incident volume per organization by industry (n=125)
Monthly actioned incidents (frequency)
When comparing the actioned incident count per month to the event count per month, the data show that:
- The event volume was high but stable, and actioned incidents followed a similar pattern. Both events and actioned incidents peaked in October, suggesting a correlation. In addition, the lowest number of actioned incidents occurred in May, aligning with one of the lower event months.
- The overall shape of both curves was quite aligned, indicating that the alerting or incident workflow responds proportionally to the scale of events. This suggests that the monitoring systems weren’t overloaded or under-triggered in certain months, which is a good sign.
- Even during the high-volume months like July through October, actioned incidents increased steadily but didn’t spike uncontrollably. This could point to effective alert thresholds, deduplication, or noise suppression.
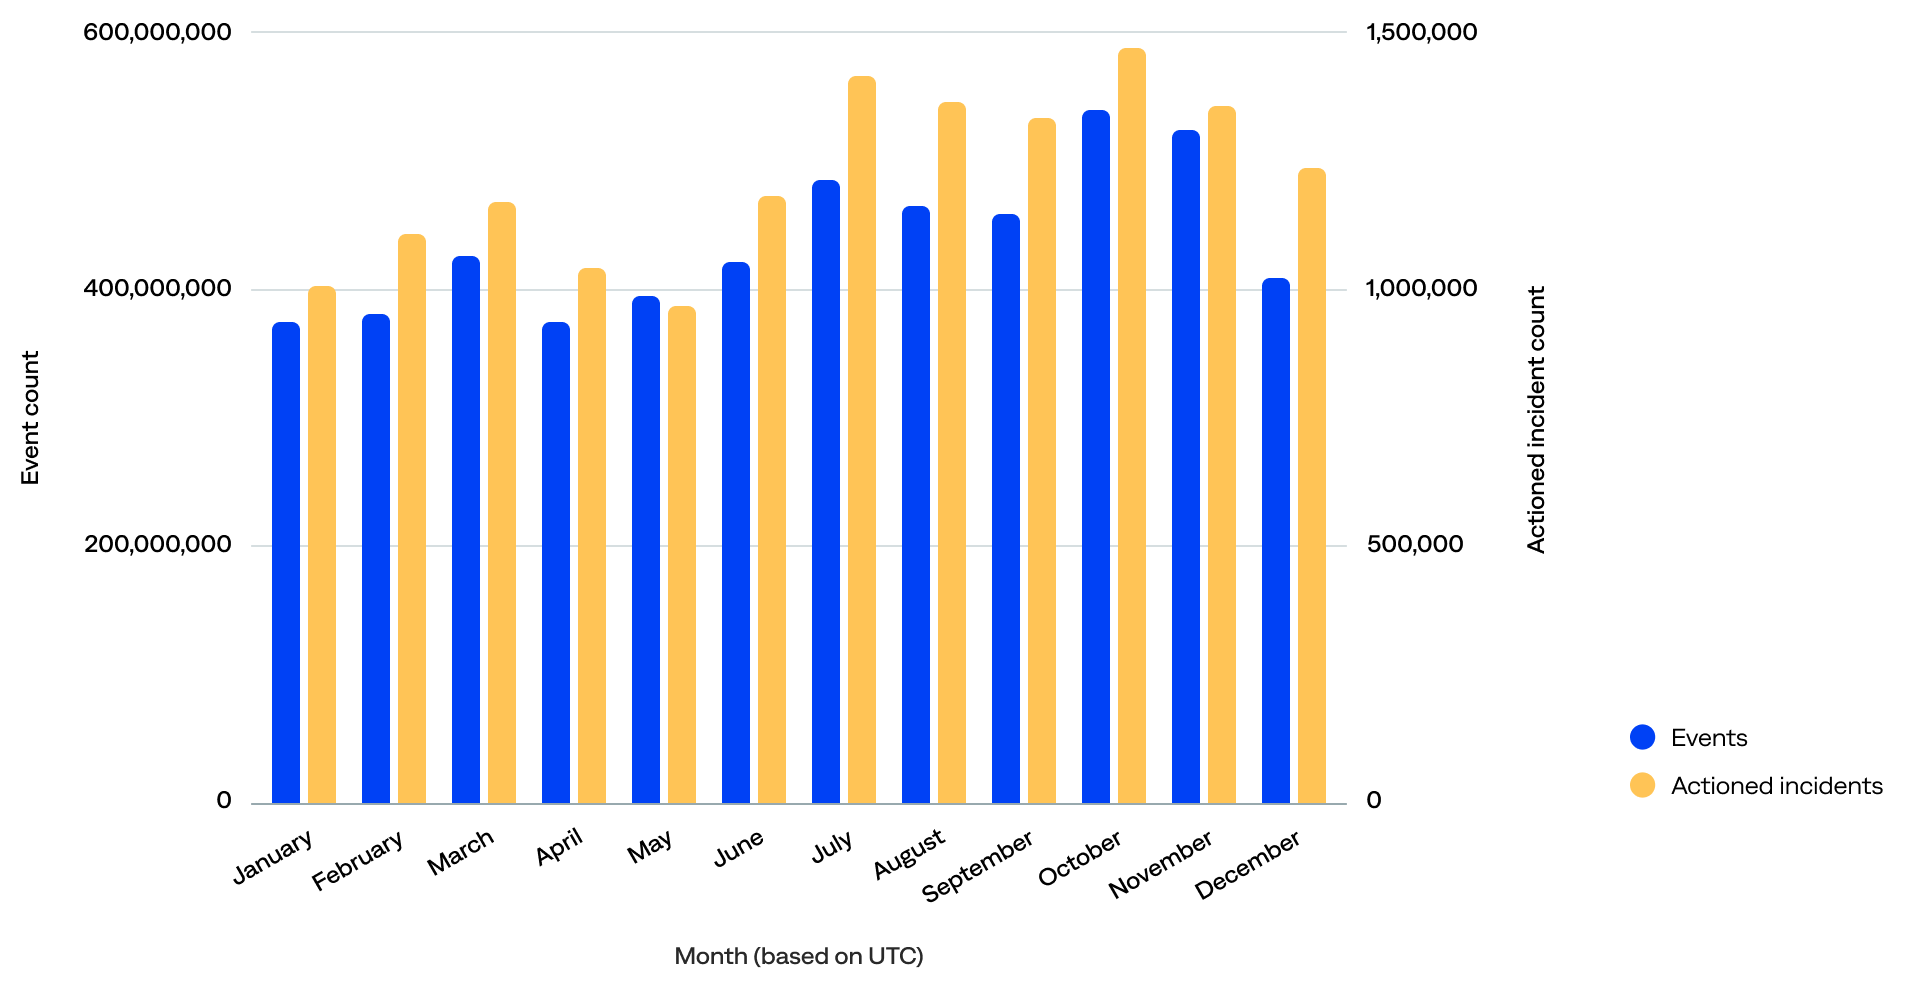
Monthly event count compared to monthly actioned incident count (n=125)
Daily actioned incident volume
BigPanda generated nearly 55,000 actioned incidents per day for the organizations included in this report. After filtering out the five event outliers, there were 53,900 actioned incidents per day. The median was 110 actioned incidents per day per organization.
- Over a third (37%) of organizations actioned 10–99 incidents per day (medium-to-medium-high volume).
- More than a quarter (29%) actioned 100–499 incidents per day (high volume).
- Nearly a quarter (22%) actioned 500 or more incidents per day (very high volume).
- Just 12% actioned fewer than 10 incidents per day (very-low-to-low-medium volume), including 2% with less than daily actioned incidents, likely representing onboarding organizations.
of organizations actioned 500+ incidents per day
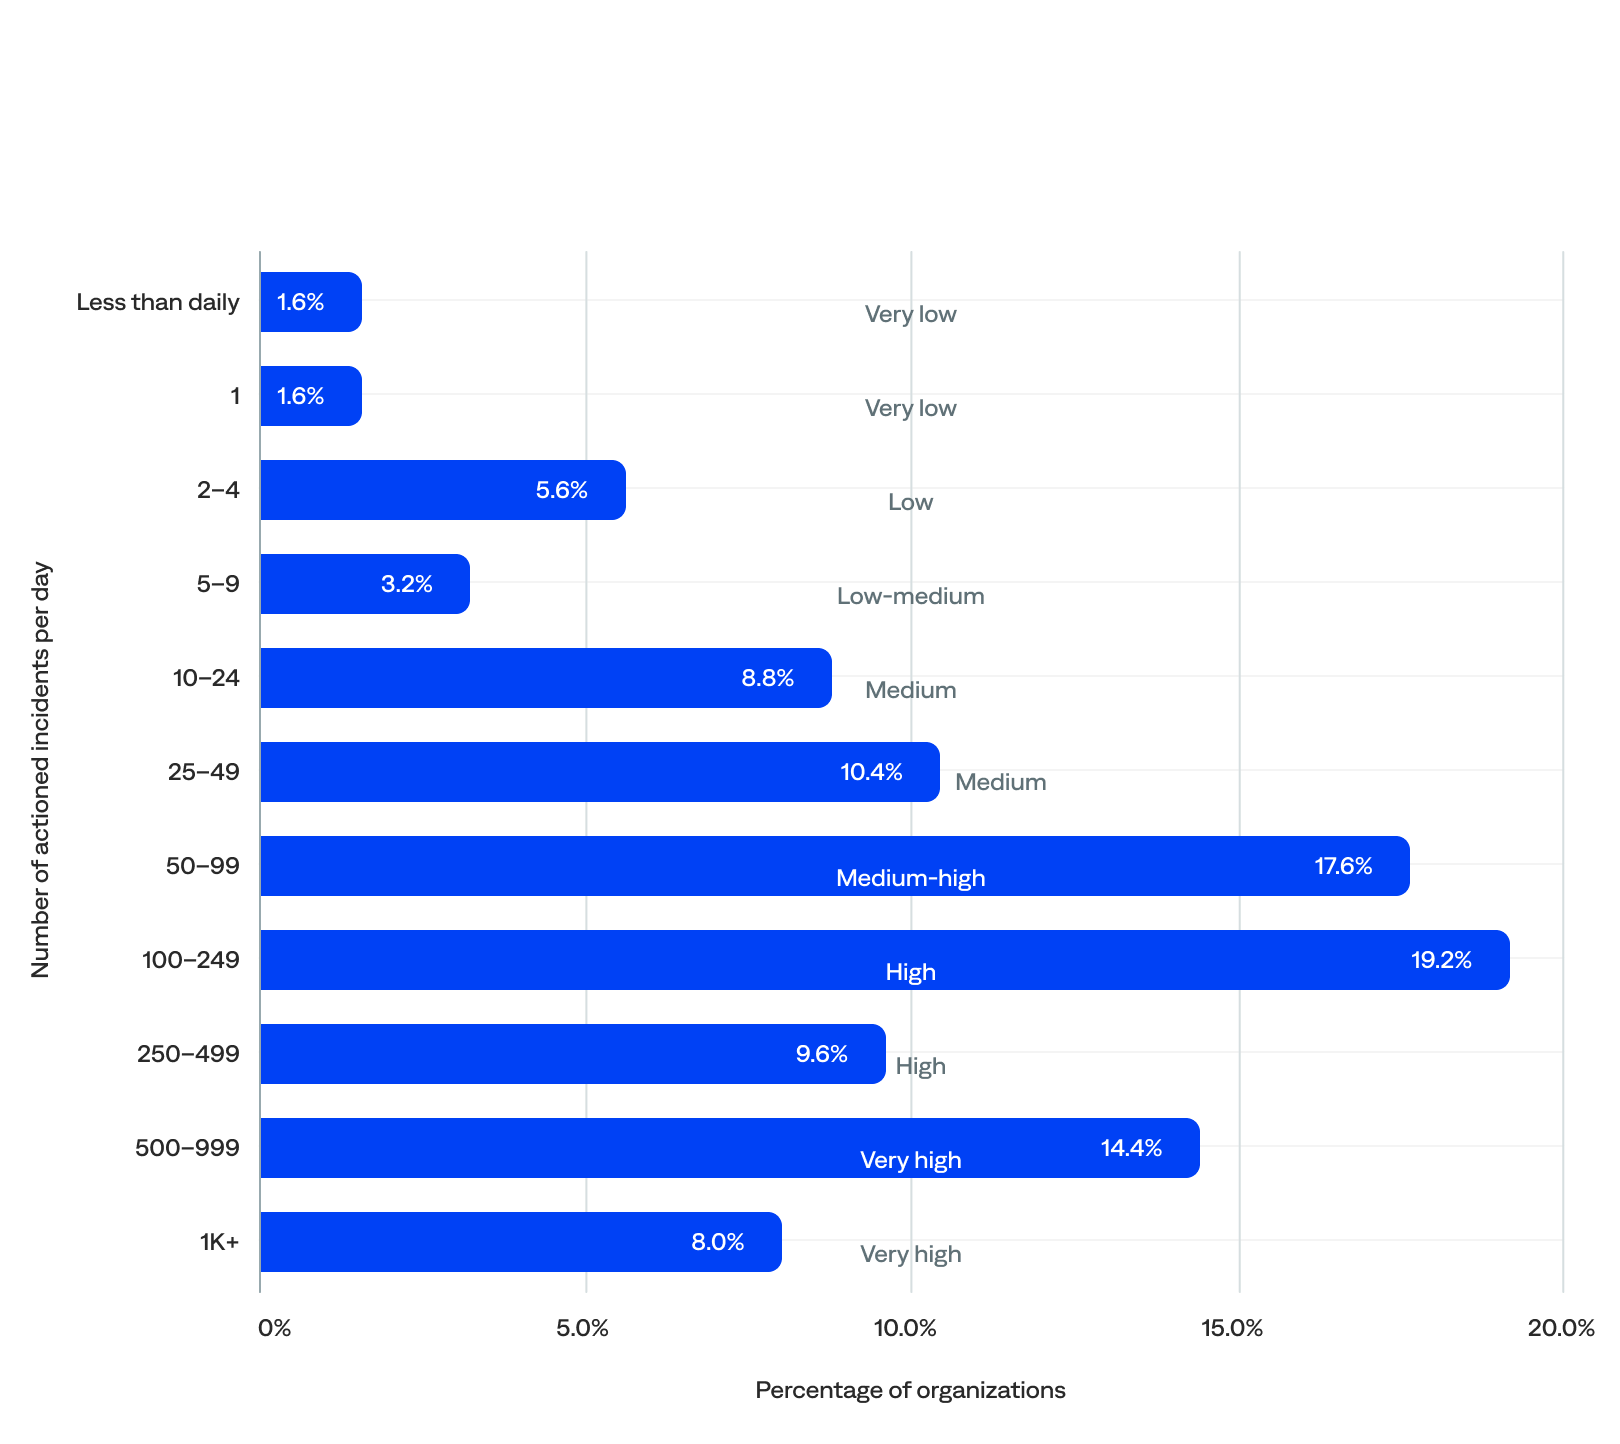
Daily actioned incident volume (n=125)
Actionability rate
The actionability rate is the percentage of incidents that were actioned (incident-to-actioned-incident rate).
Both high and low actionability rates can be good or bad.
- High actionability could mean that an organization has reduced noise by removing incidents that don’t need to be acted on (good), or teams are unnecessarily acting on noisy incidents (bad).
- Low actionability can mean that monitoring and observability tools send a lot of noisy, unactionable events to BigPanda (bad), or teams use BigPanda as an excellent filter to prevent unactionable tickets from being created in the first place (good).
BigPanda customers with incident management teams working in ITSM platforms typically have higher actionability rates because they use BigPanda to reduce, correlate, and ticket immediately. However, most organizations only take action on a very small percentage of incidents because their monitoring and observability tools generate a lot of noise. BigPanda helps them focus only on what’s important.
With BigPanda unified analytics, teams get the visibility and insight they need to differentiate valuable signals from noise and only take action on what matters, reducing overall ticketing and focusing on high-severity and priority incidents. It also helps them pinpoint which monitoring and observability tools provide valuable signals versus which are noisy, so they can filter and ignore the ones that don’t make the cut.
Actionability rate for all organizations
The median actionability rate was 18%.
- Over half (51%) of organizations had a very-low-to-low actionability rate of less than 20%. The lowest actionability ranges had the highest incident volumes, likely due to high alert noise, poor correlation or triage mechanisms, or a lack of automation in incident handling.
- Over a quarter (27%) had a medium-high-to-extremely-high actionability rate of 50% or more, including 19% with 70% or higher and 5% with 90% or higher.
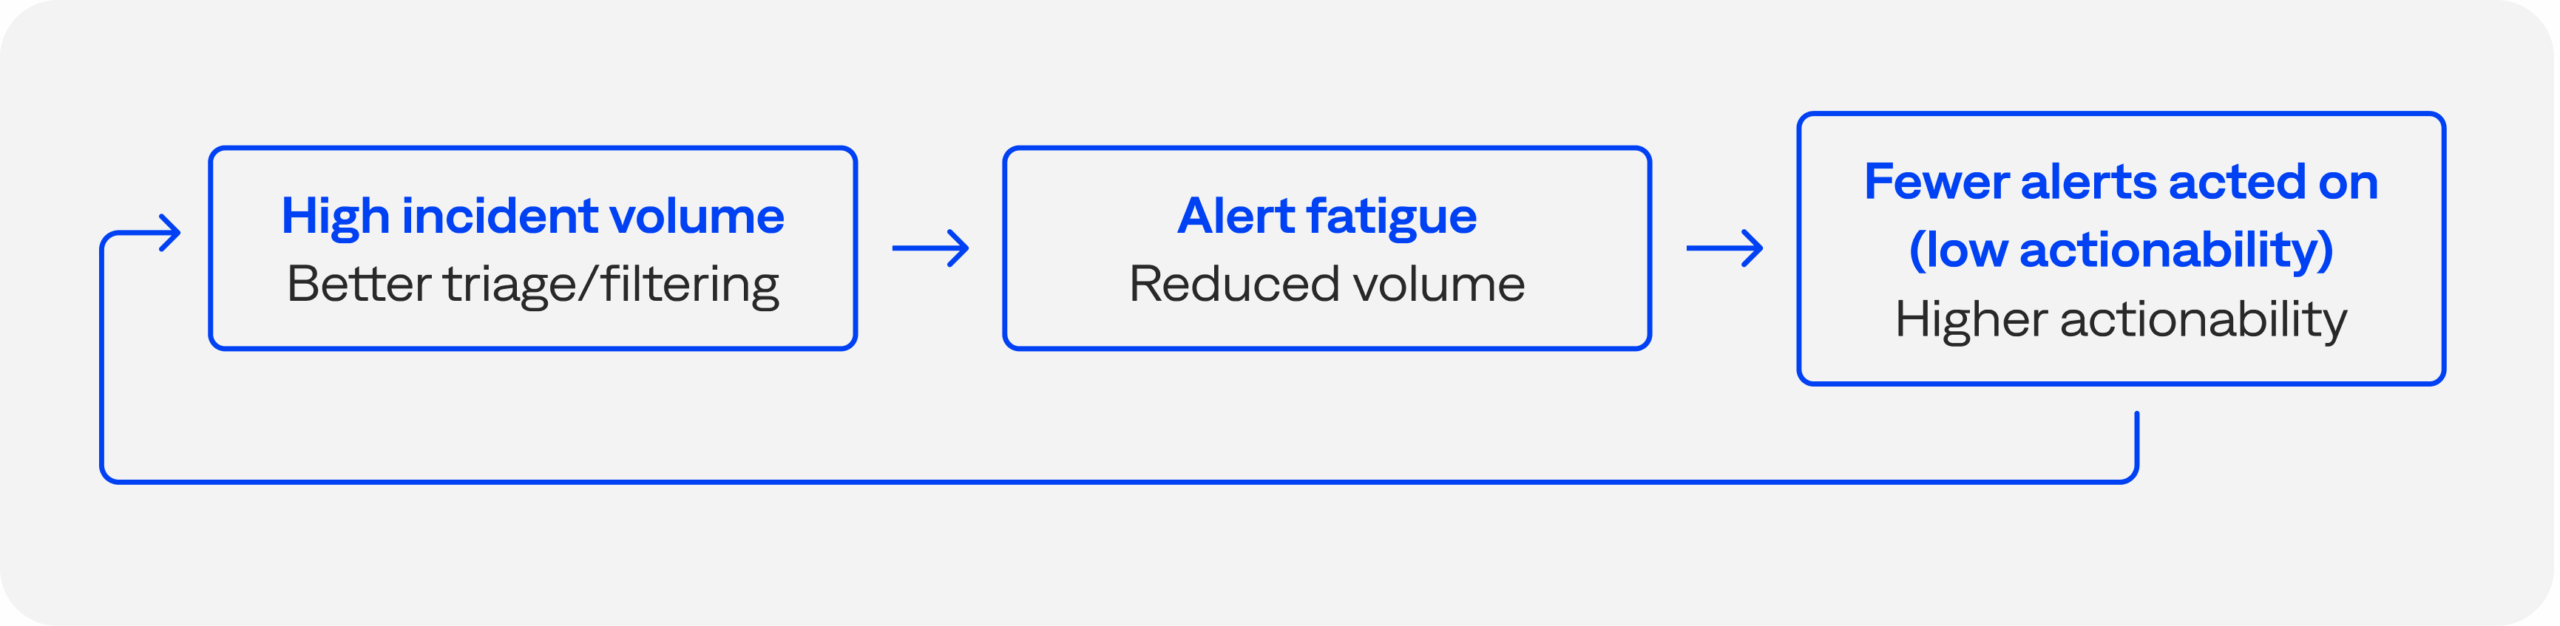
- There was a moderate negative correlation between median incident count and actionability rate; organizations that experienced a higher incident volume often had lower actionability rates, while those with lower incident volumes tended to have higher actionability rates. There’s likely a causal feedback loop. That said, correlation is not causation.
of organizations had a <20% actionability rate
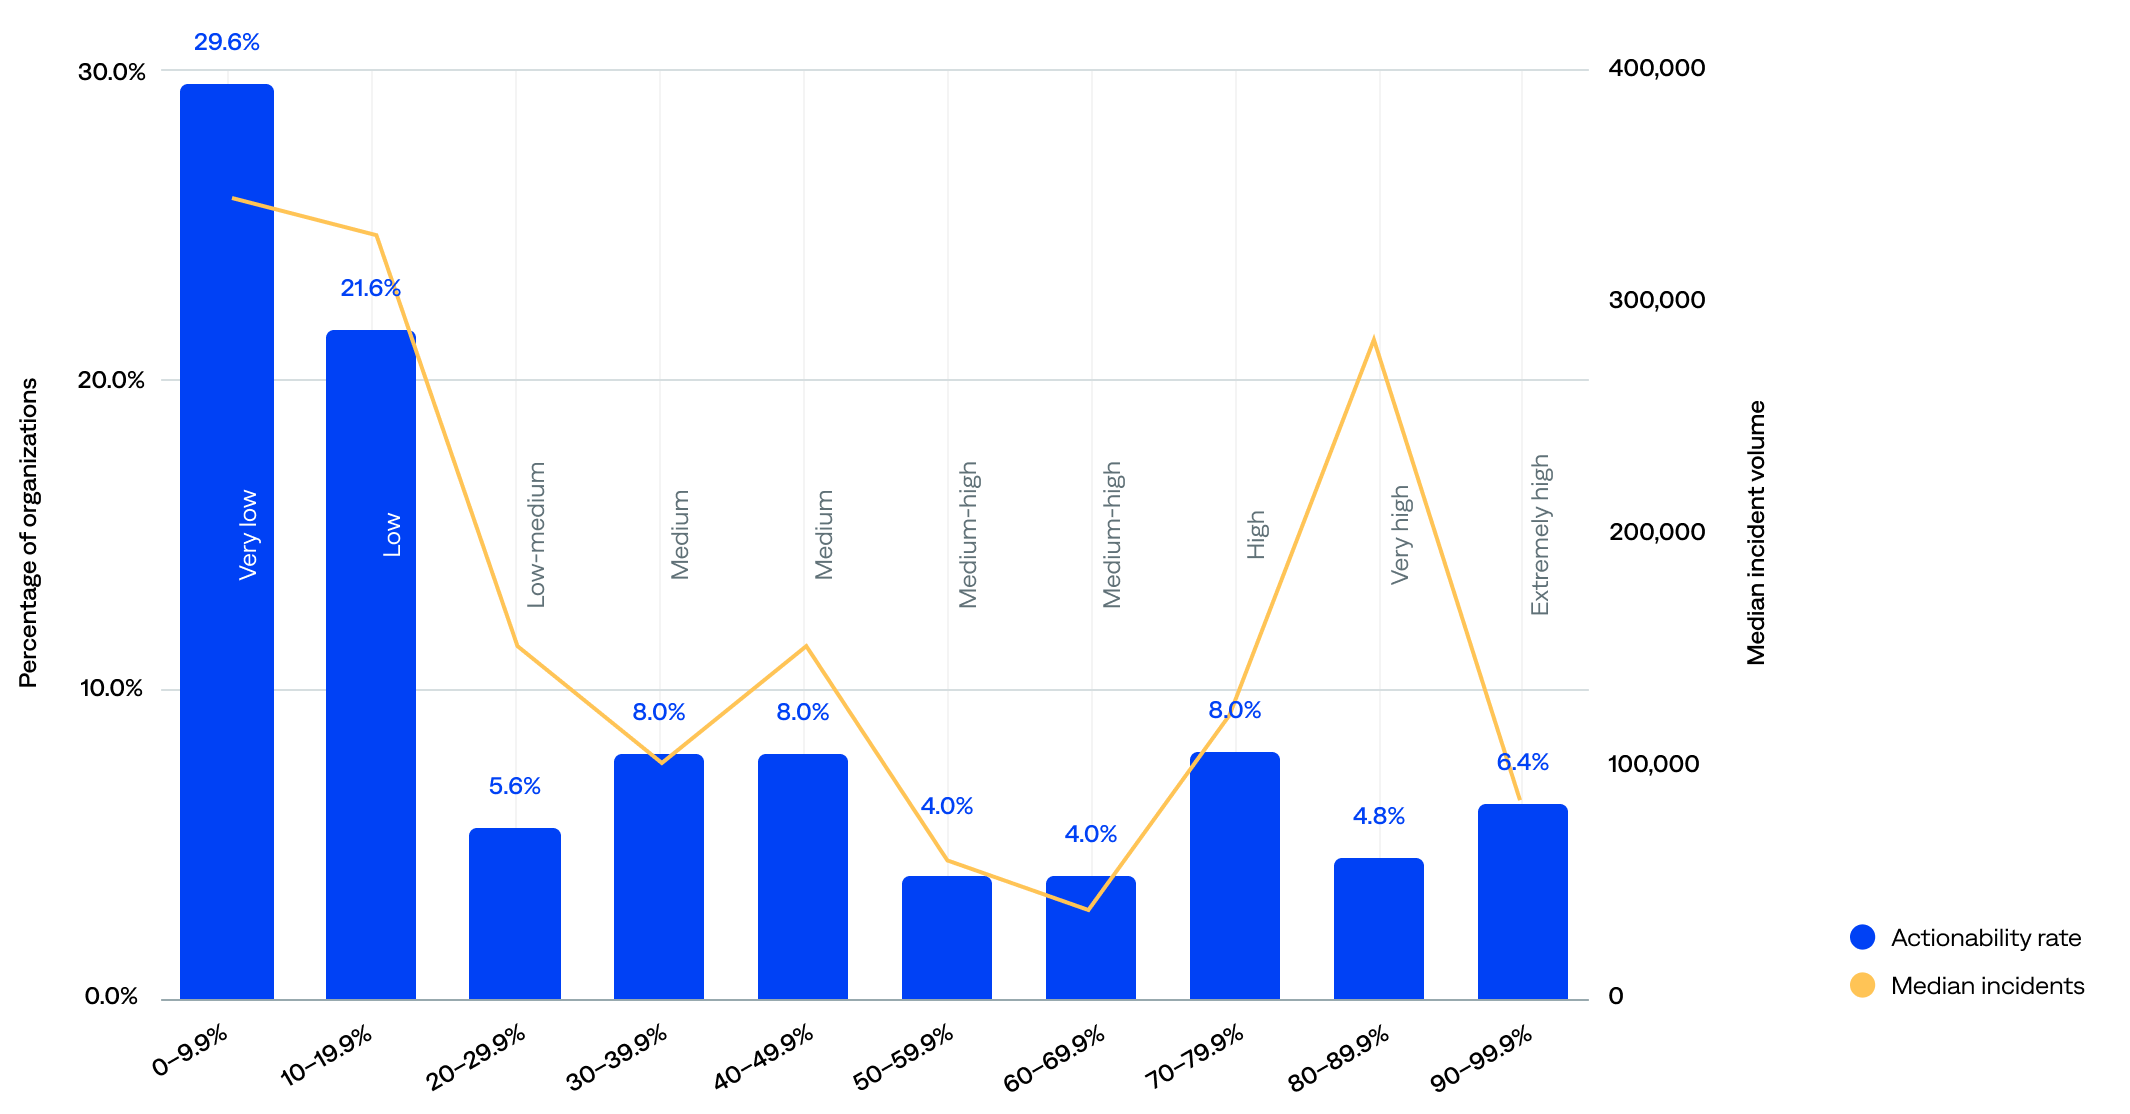
Actionability rate (incident-to-actioned-incident) compared to median incident volume (n=125)
Actionability rate by industry
There are similar patterns when looking at actionability rate and incident volume by industry (higher incident volumes correlate with lower actionability):
- Healthcare organizations had the highest median actionability rate (68%), followed by retail (60%), suggesting strong incident response workflows, effective alert correlation or triage, and possibly narrower, more focused monitoring scopes.
- Telecommunications organizations had the lowest median actionability rate (6%), followed by transportation (11%), and high incident volumes, suggesting they may be overwhelmed by incident load, under-automated, lacking efficient triage, or needing tuning or alert suppression.
- Three industries showed room for optimization, with relatively low incident volumes but average actionability rates: professional services (38%), managed service providers (35%), and media/entertainment (32%).
- Three industries had relatively low incident volumes and low actionability rates: manufacturing (12%), technology (14%), and insurance (17%).
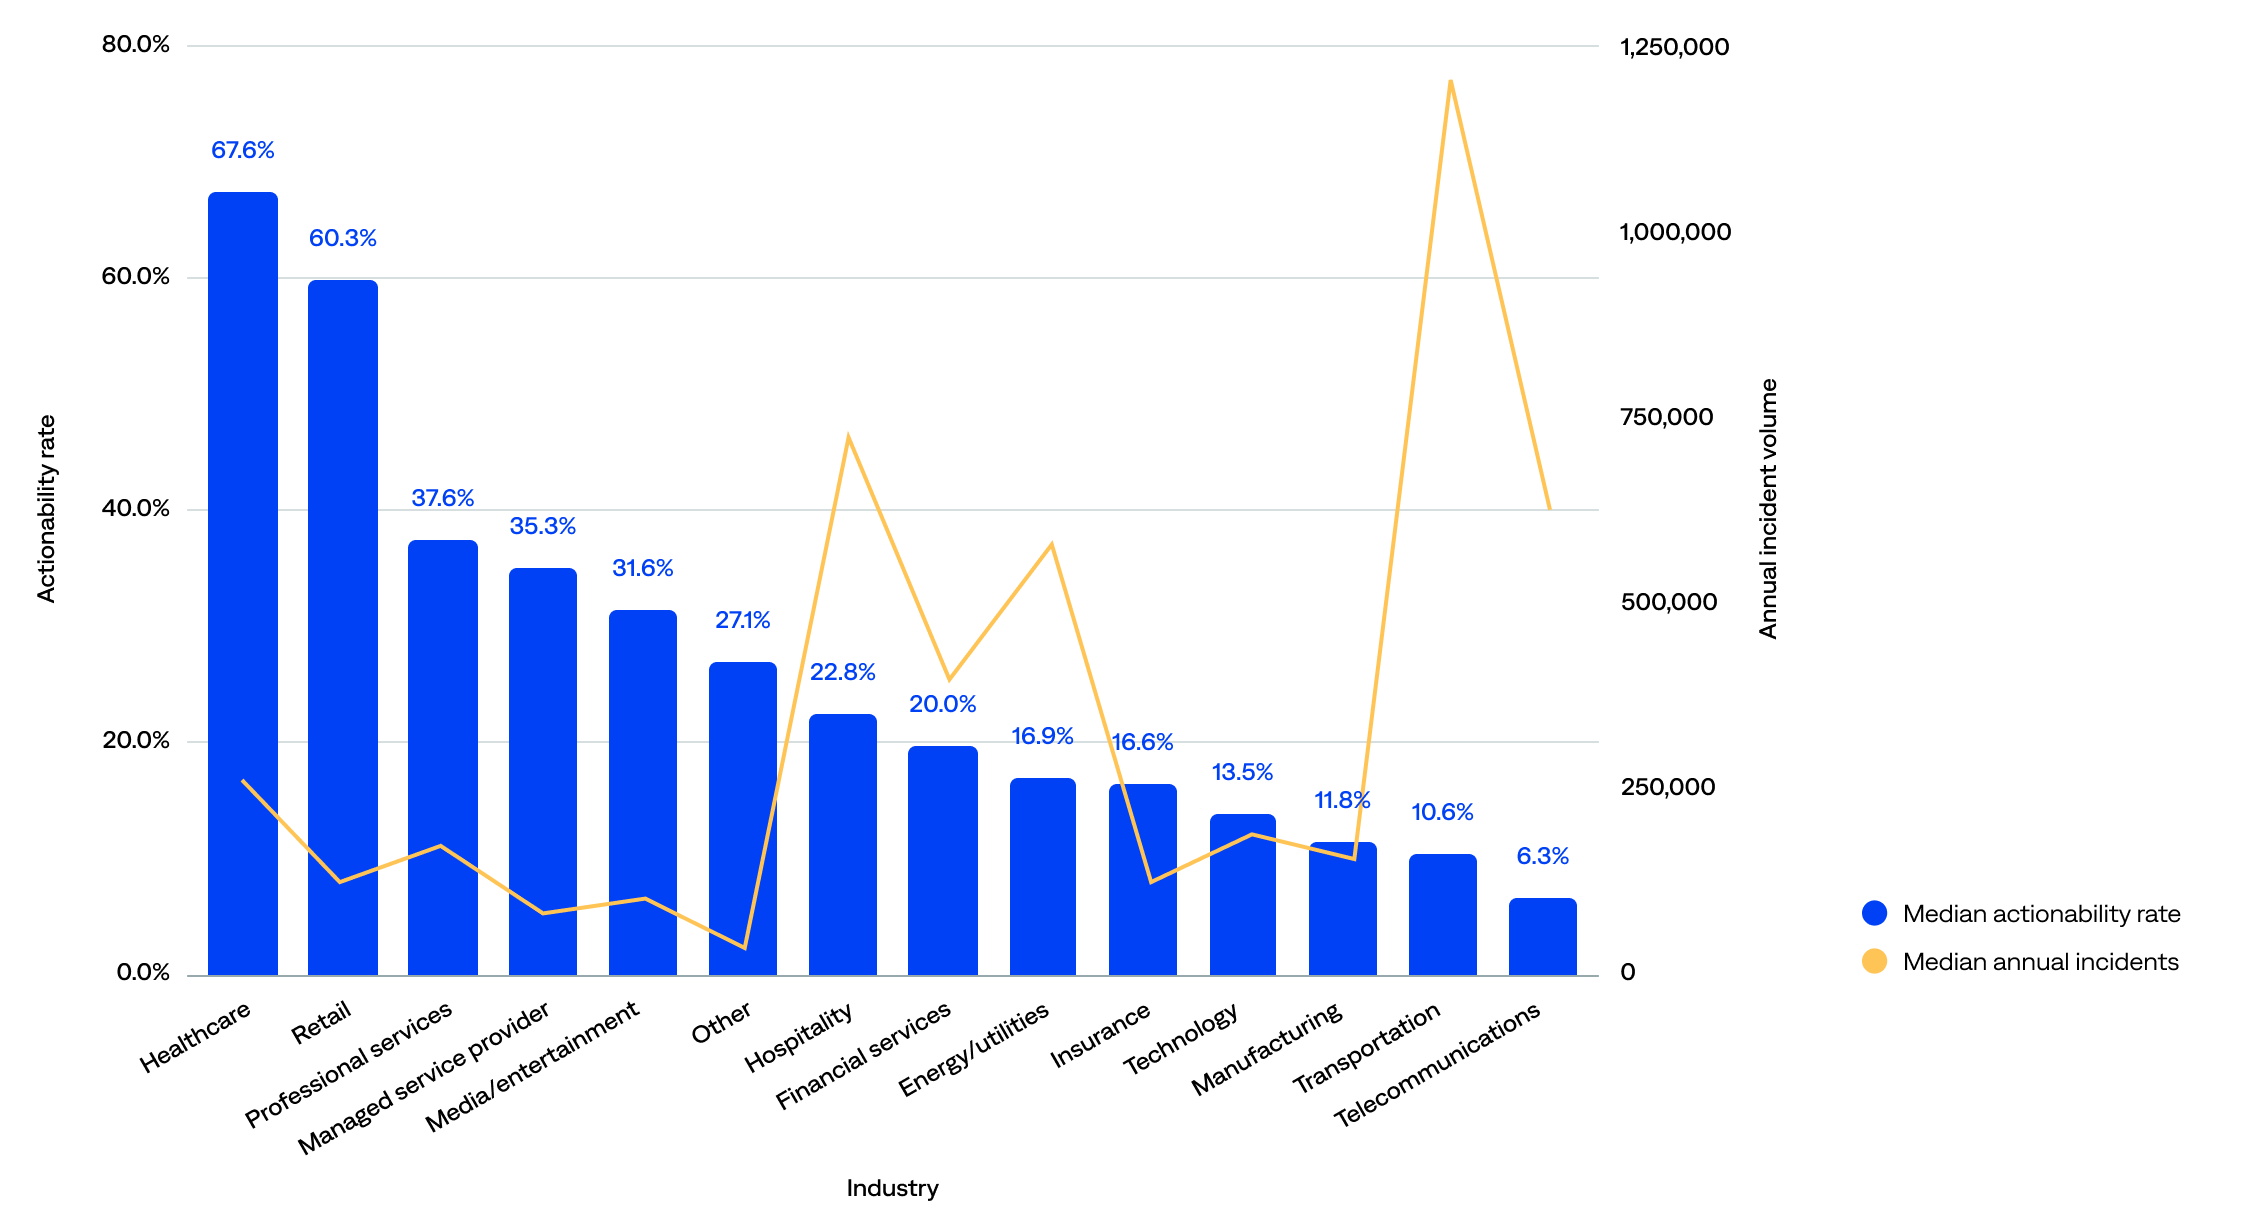
Actionability rate (incident-to-actioned-incident) compared to median incident volume by industry (n=125)
Noise reduction rate
The noise reduction rate is the percentage of raw events that become actioned incidents (event-to-actioned-incident rate or end-to-end noise reduction rate).
The noise reduction rate ranged from 83% to 99.9%, and the median was 99.6%. In other words, they reduced incident-related noise by up to 99.9%, from raw events to actionable incidents—essentially filtering out all but the most critical signals. This supports the earlier finding that most organizations using the BigPanda platform have excellent filtering practices.
- Most (82%) organizations had an exceptionally high noise reduction rate (97% or higher), including 54% with 99.5% or higher and 28% with 99.9%. This points to highly effective correlation, deduplication, and suppression practices among these organizations.
- Only 16% fell into the medium 90–96.9% noise reduction rate range. These organizations likely reduce most noise but still pass a noticeable volume of events through as incidents, indicating opportunities to improve correlation rules or filters and tune alert thresholds or enrichments.
- Just 2% had a noise reduction rate below 90%. These organizations were likely still onboarding.
of organizations had a 99.5+% noise reduction rate
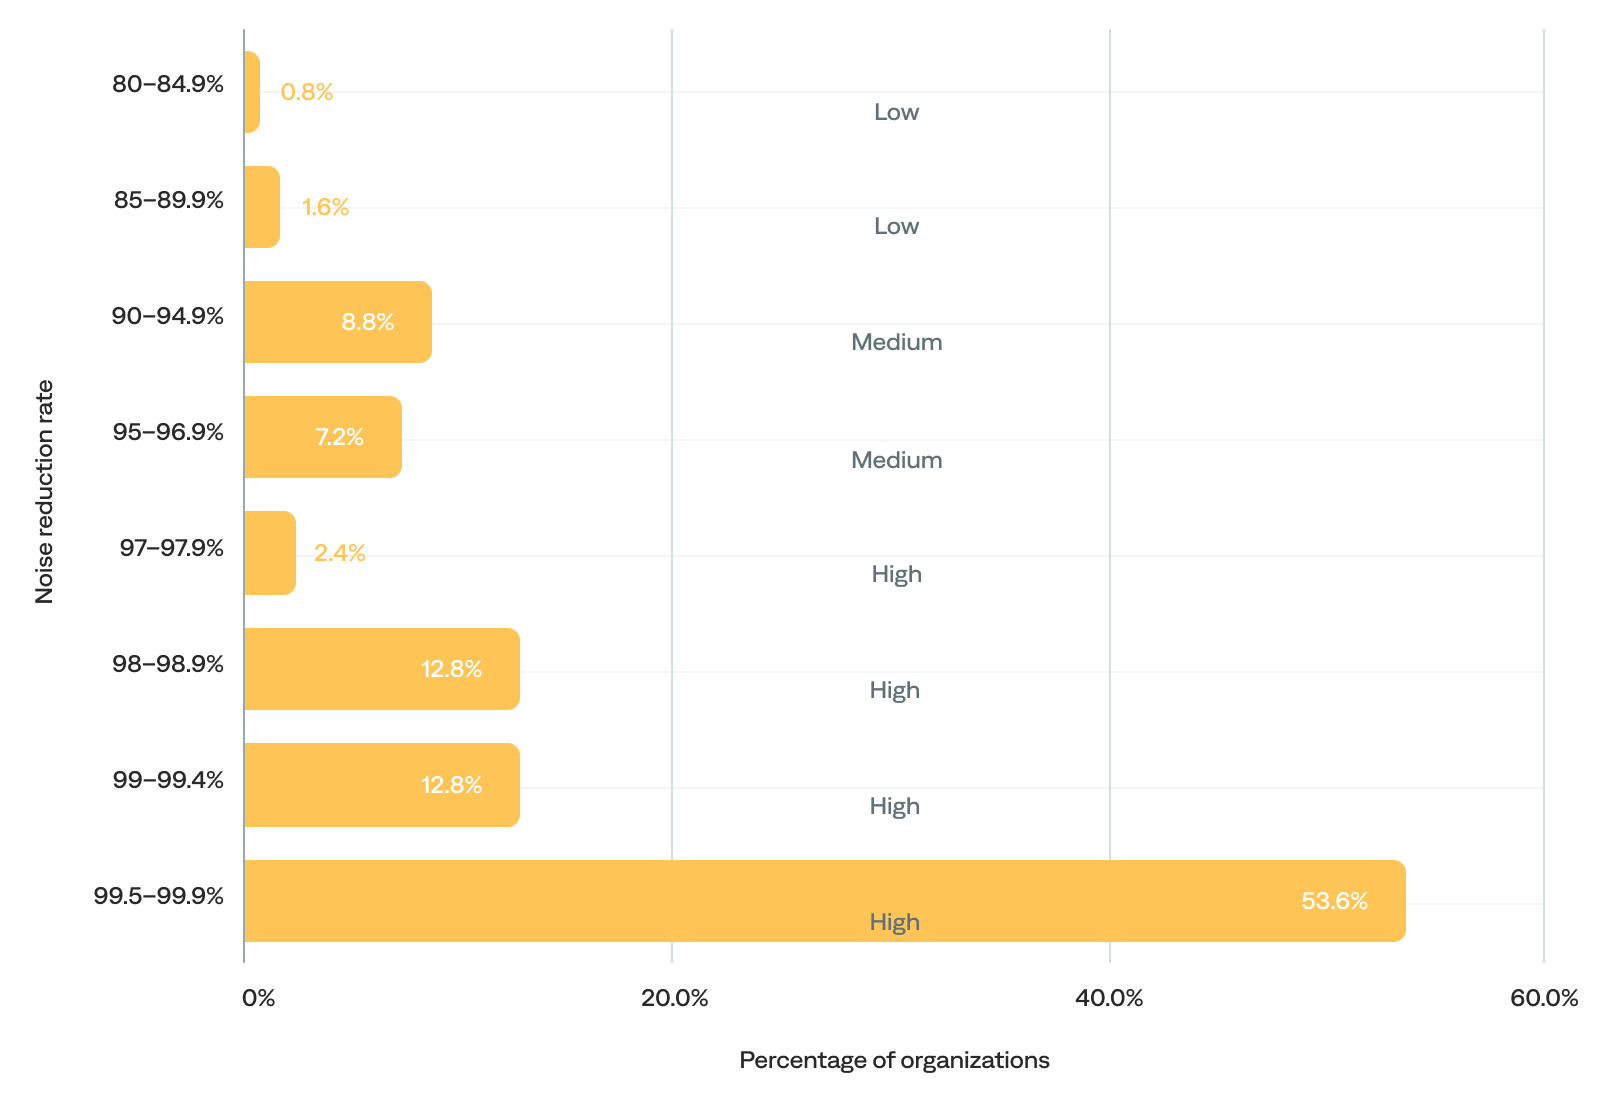
Noise reduction rate (event-to-actioned-incident) (n=125)
“BigPanda enabled us to implement AI that reduces alert noise and gets us to the root cause faster.”
–Divisional CTO, Managed Services Provider

- PlatformPlatform
- Agentic IT Operations
- Platform Overview
- AI Detection & Response
- AI Incident Assistant
- AI Incident Prevention
- IT Knowledge Graph
- BigPanda AIOps
- BigPanda Core
- Advanced Insight
- Biggy AI
- Rebranding Matrix
- Integrations
- Security & Compliance
- Features
- Detection
- Open Integration Hub
- Event Correlation
- AI Detection
- Diagnosis
- Service Desk Correlation
- Suggested Actions
- Triage
- Automated Incident Triage
- Root Cause Analysis
- Similar Incidents
- Prevention
- Change Risk Management
- Problem Management