-
Platform
-
-
Agentic ITOps Platform
 The BigPanda agentic ITOps platform uses AI to automate IT detection, triage, and resolution, improving operational efficiency and reducing downtime and costs.Explore the Platform
-
-
-
Solutions
-
-
Transform ITSM with Agentic ITOps
Learn how enterprises can empower incident management teams with AI assistance by integrating agentic AI into their incident management strategy.Get the e-book
-
-
-
Resources
-
-
Derisking IT Change Management with Agentic AI
Discover how agentic AI transforms the IT change management process to predict high-risk changes, prevent incidents, and protect engineering time.Read the White Paper
-
-
-
Company
-
-
Careers
 We’re looking for talented, passionate, creative, and fun people to join our embarrassment of Pandas. (Yes, that’s really what a group of pandas is called!)Learn More
-
-
- Language


The Business Value of the BigPanda
Insights on incident detection and noise reduction in the enterprise

IT investment justification overview
Organizations, especially large enterprises, require financial justification for significant technology purchases, such as those related to infrastructure and operations (I&O). I&O leaders and executive buyers must quickly see value, supported by relevant key performance indicators (KPIs).
However, many enterprises lack the knowledge, research metrics, tools, and/or resources to deliver the requisite financial justification. It’s a time-consuming, resource-intensive process, and many cannot easily aggregate and synthesize all the relevant data into meaningful business insights.
According to Gartner®, many IT operations (ITOps) teams fail to realize the full potential of their event intelligence solution, thereby realizing a limited value beyond event correlation and noise reduction. This challenge can lead to a perceived lack of business value, an inability to justify cost, and a reevaluation of vendors and the market. To successfully demonstrate a return on investment (ROI), they recommend that I&O leaders start with a clear understanding of the pain points they wish to solve and how to measure tangible benefits.
Proven value can be elusive, but it’s not for BigPanda customers. BigPanda helps its customers identify challenges and quantify the impact of the BigPanda platform on business outcomes—not just ITOps and IT service management (ITSM) outcomes.
BigPanda business value assessments can help enterprise executives:
- Articulate business impact and demonstrate progress. Quantifying improvements across key operational and business metrics helps showcase tangible progress to stakeholders throughout the organization.
- Drive strategic change. More substantial financial justification helps build an ironclad business value case to secure executive approval and funding, positioning them as champions who drive impactful change and solve critical IT challenges.
- Uncover insights and areas for improvement. Robust ITSM analysis can help quantify key metrics, such as incident volume and mean time to resolution (MTTR).
This report summarizes the business value of the BigPanda platform. It’s based on recent business value assessments conducted by the BigPanda business value services team using enterprise customer data and feedback.
Executive summary and key findings
Enterprises realized considerable value and ROI from the BigPanda platform. On average, BigPanda customers experience $2.85 million in annual benefits and a 430% ROI, with a typical payback period of less than a year. View an infographic of the key findings.
Figure 1. Key report findings
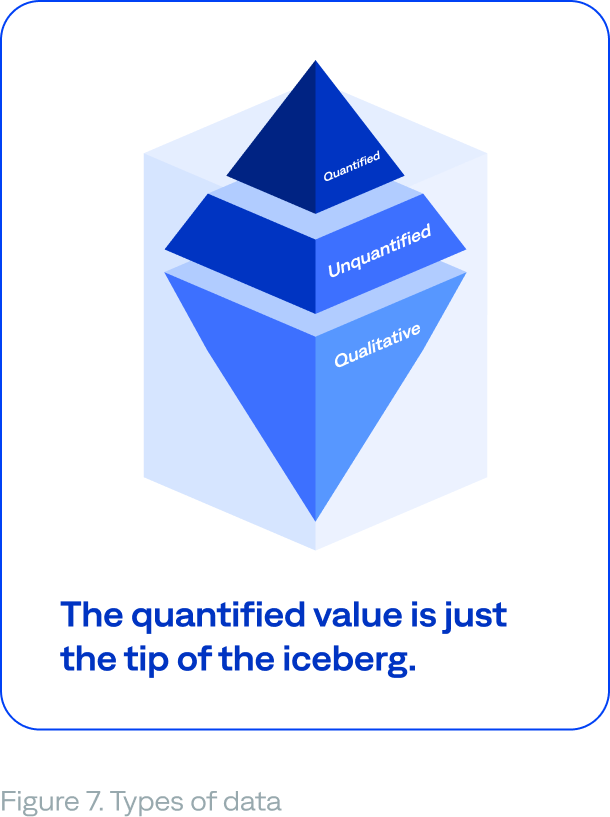
However, the quantitative data is just the tip of the iceberg. Anecdotal customer feedback highlights additional qualitative benefits that are often harder to measure, such as improved employee and customer experience, satisfaction, and retention, as well as reduced service-level agreement (SLA) penalties.
The report’s findings underscore the ability of BigPanda to drive transformational business value across some of the world’s largest, most operationally complex enterprises.
Value drivers and benefits of the BigPanda platform
This section reviews quantitative and qualitative value drivers and metrics for the BigPanda platform, including quantifiable value that can be translated into financial savings.
BigPanda customers provided quantitative data such as ticket volume, cost per ticket, MTTR, bridge call costs, existing IT costs, and major incident/outage duration.
The BigPanda business value services team used that data, along with BigPanda platform data, to quantify value, including reduced workloads, IT costs, and the duration of major incidents.
Not all value drivers are easily quantifiable. BigPanda customers typically experience additional indirect impacts, often supporting C-level corporate initiatives and objectives.
Table 1. Value drivers of the BigPanda platform by data, benefit, result, and impact type
– Quantitative
– Qualitative
– Improved operational efficiency
– Enhanced service reliability
– Revenue protection
– Cost reduction and avoidance
– Blue dollars
– Green dollars
– Teal dollars
Workload reduction and cost savings
The BigPanda platform can help enterprise ITOps and ITSM teams improve operational efficiency by reducing manual toil, ticket volume, MTTR, bridge call volume and duration, onboarding time, and training time. The reduced workload results in cost reduction, cost avoidance, or reallocation of resources. The resulting ticket volume and labor cost savings translate green or blue dollars.
Manual toil and labor cost avoidance
By automatically deduplicating, filtering, and correlating alerts, BigPanda helps customers reduce or avoid noisy alerts and incidents. It also reduces or eliminates the need for manual triage and monitoring.
For example, Table 2 illustrates how automation helped six BigPanda customers avoid manual toil and its associated labor costs. Based on the number of annual alerts, hours of manual toil per alert pre-BigPanda, hourly labor cost, and the number of full-time employees (FTEs) affected, the median annual hours of work saved were 14,909, representing a median annual labor cost savings of $539,500 (blue dollars).
This manual toil avoidance freed IT teams to reallocate the extra time by pivoting to new or strategic value-added initiatives, amplifying the business impact. This impact has the potential to be transformative for complex global enterprises

UP TO
AVOIDANCE of annual manual toil and labor costs
| Enterprise customer | Alerts | Manual toil hours/alert pre-BigPanda | Labor cost per hour | FTEs | Labor hours avoided | Labor cost avoided |
|---|---|---|---|---|---|---|
| Customer A | 22,800,000 | 0.02 | $35 | 190 | 380,000 | $13,300,000 |
| Customer B | 670,000 | 0.25 | $40 | 20 | 40,000 | $1,600,000 |
| Customer C | 3,900,000 | 0.20 | $35 | 11 | 22,700 | $800,000 |
| Customer D | 96,000 | 0.08 | $40 | 4 | 7,100 | $280,000 |
| Customer E | 412,000 | 0.02 | $35 | 3 | 6,900 | $240,000 |
| Customer F | 48,000 | 0.08 | $50 | 2 | 4,000 | $200,000 |
| Median | 542,577 | 0.08 | $38 | 7 | 14,909 | $539,500 |
Table 2. Hours of manual toil and labor cost avoided with BigPanda (n=6; individual values rounded, medians as calculated)
Reducing massive amounts of alerts:“BigPanda helped us reduce our alert volume, cutting noise by 97%—from about 3 million down to 75,000 a month.” —IT Operations Leader
Customer feedback on avoiding manual toil and labor costs:
-
- Eliminating manual alert monitoring: “All alerts were manually monitored, deduplicated, and correlated pre-BigPanda, on a one-by-one basis. BigPanda saves us a lot of time and lets us focus on resolving issues instead of combing through thousands of alerts to identify the problems.” —IT Operations Leader
- Scaling with business growth: “Before implementing BigPanda, our unit was growing rapidly, generating millions of data points and events. We had no processing layer in between events and our NOC. We were drowning in noise and unable to scale and keep pace with the growth of the business.” —Operations Manager
- Letting BigPanda handle the noise: “BigPanda transformed how we looked at monitoring. We no longer say things like ‘silence this’ or ‘change this threshold.’ Now we’re saying firehose everything at BigPanda and let it do the heavy lifting.” —Engineering Leader
Ticket volume reduction, avoidance, and cost savings
Before implementing BigPanda, most teams manually triaged, reviewed, and created tickets. BigPanda helps enterprise customers reduce or avoid tickets through deduplication and correlation.
Figure 2 shows the ticket volume reduction rate ranged from 10% to 87%, with a median of 43%. Over half (53%) reduced their ticket volume by at least 40%, including three (18%) that reduced their ticket volume by at least 70%.
MEDIAN
REDUCTION in ticket volume
Figure 2: Ticket volume reduction rate (n=17)
Reducing duplicates and streamlining alerts: “From about 30 million events, we ended up with about 200,000 tickets—BigPanda deduplication and noise filtering played a key role in reducing duplicates and streamlining alerts.” —IT Operations Leader
Figure 3 shows that the ticket volume reductions resulted in considerable annual savings, ranging from approximately $70,000 to $13.6 million, with a median of $2,309,200 (blue dollars). Most (83%) achieved at least $500,000 in annual ticket volume savings, including half (50%) that experienced savings of at least $2 million and nearly a quarter (22%) that achieved transformational savings of $5 million or more annually.
UP TO
SAVINGS in annual ticket volume costs
Figure 3: Annual ticket volume savings for BigPanda customers (n=18)
Customer feedback on reducing and avoiding tickets:
-
- Scaling faster by reducing ticket volume: “The ability to take highly enriched, highly contextualized alerts and turn them into way fewer and much more actionable incidents allowed us to scale significantly quicker. Before BigPanda, every alert was a ticket, and we actioned everything.” —Operations Manager
- Avoiding ticket overload: “BigPanda really helps during peak volumes. Instead of a thousand separate tickets overwhelming the NOC, BigPanda correlates them so we can see they’re all related. That means one person can take the ticket instead of scrambling twenty techs to figure it out.” —Operations Manager
- Keeping ticket volume flat: “We onboarded a lot more applications and service models in 12 months, but thanks to BigPanda, the number of user-created tickets hasn’t gone up. In fact, BigPanda-opened incidents have gone down, which shows the filtering and correlation are working as our environment grows.” —IT Director
Bridge call volume, duration, and cost reduction
Incident-related bridge calls often involve multiple teams and can be very costly due to the high number of participants and extended call duration.
For example, customer A in Table 3 below experienced over 100 major incidents in three months and reported that every single one triggered a bridge call. Another customer noted that their bridge calls last about two hours on average.
With BigPanda, teams can identify issues before they become major outages. When a major outage occurs and an ensuing bridge call is initiated, BigPanda pings only the relevant team members, arming them with the necessary information about what happened and how to resolve it, which leads to fewer and shorter bridge calls. The reduced call volume, duration, and number of attendees translate into considerable labor cost savings and decreased business disruptions (blue dollars).
In two customer examples, the average bridge call cost reduction ranged from 35% to 74%, resulting in annual cost savings of $1.8 million to $3.2 million.
UP TO
SAVINGS in annual bridge call costs
| Enterprise customer | Bridge call cost reduction rate | Annual bridge call reduction savings |
|---|---|---|
| Customer A | 35% | $3,200,000 |
| Customer B | 74% | $1,800,000 |
Table 3. Bridge call cost reduction rate and annual savings for BigPanda customers (n=2; rounded values shown)
Reducing and shortening bridge calls:“Bridge calls are fewer and shorter now. BigPanda definitely helps get the right people in faster.” —Monitoring Engineer
MTTR reduction and cost savings
BigPanda also helps enterprise IT teams detect, diagnose, and resolve issues faster by consolidating and analyzing overwhelming alert data, enriching alerts with relevant metadata, and ensuring the right resources are attached. Automating and streamlining incident management processes helps reduce the internal labor costs associated with resolving incidents.
Table 4 shows that, based on the number of pre- and post-BigPanda MTTR hours per ITSM ticket for five customers, the MTTR reduction rate ranged from 19% to 81%. Factoring in the cost per ticket, the annual cost savings due to reducing MTTR with BigPanda ranged from $70,000 to nearly $1.5 million (blue dollars).
UP TO
SAVINGS in annual MTTR-related costs
| Enterprise customer | MTTR reduction rate | Annual MTTR reduction cost savings |
|---|---|---|
| Customer A | 40% | $1,500,000 |
| Customer B | 19% | $840,000 |
| Customer C | 51% | $460,000 |
| Customer D | 29% | $250,000 |
| Customer E | 81% | $70,000 |
Table 4. MTTR reduction rate and cost savings with BigPanda (n=5; rounded values shown)
Customer E noted that the MTTR for tickets handled by BigPanda was appreciably less than that handled by other sources across all priority levels, with priority-one incidents resolved about 20 times faster. On average, all its high-priority tickets were resolved within one hour.
Customer feedback on reducing MTTR:
- Detecting earlier, resolving faster: “Centralizing our operations with BigPanda allowed us to have a much earlier MTTD, which gave us a head start in resolving operational incidents.” —IT Operations Manager
- Pinpointing issues faster: “BigPanda helps identify and pinpoint the issues quickly.” —IT Operations Director
- Showing value beyond dollars: “With how we structure contracts, costs aren’t tied to individual tickets or incidents. We pay by resource unit, like maintaining 2,000 servers. So, I can’t translate time savings directly into dollars. What I can show is the difference in hours—how much effort BigPanda helped us shave off and how that reduced MTTR. But it clearly shows value, even if not in dollar terms.” —IT Director
Detecting in one minute: “Biggy feeding directly to relevant Slack channels caused MTTD to go down to one minute.” —IT Operations Director
Workforce cost optimization
BigPanda enables enterprises to grow faster without scaling headcount, tool sprawl, or onboarding timelines.
With correlation, automatic ticket creation, and AI-powered triage and troubleshooting, BigPanda can help enterprises avoid additional headcount, reduce existing headcount, and reduce third-party contract spending on outsourced work.
Reducing staff or third-party contract spending on outsourced work translates to green dollars. Avoiding additional headcount translates to teal dollars—either blue dollars or green dollars, depending on whether the customer had an existing budget for additional headcount that they ultimately did not use. Enterprises can reallocate these dollars to higher-value work and scaling the business.
For example, an enterprise customer avoided $140,000 in yearly offshore contractor spending, which translated to green dollars.
UP TO
AVOIDANCE of annual additional headcount costs
Customer feedback on optimizing workforce and costs:
-
- Delivering FTE savings through automation: “When we start adding up the time savings, we’ve got several FTEs worth of time that the roboagent is taking care of. That’s the value right there—a lot of work getting done that we didn’t have to have a human do.” —Senior IT Engineer
- Avoiding additional hires: “Without BigPanda, I’d probably need four or five more people.” —Cloud Engineer
- Covering more business lines with the same team: “We started by monitoring one business line. Now we’re covering all of them without growing the team. Our team would have grown if we still did this manually.” —Operations Director
Scaling business without linear NOC costs: “BigPanda allowed us to scale and take on more business without the linear cost of the NOC.”
Onboarding and training time reduction and cost savings
BigPanda can help shorten onboarding and training timelines for new or junior employees by simplifying processes and automating tasks.
For example, a global enterprise customer onboarded and trained new hires twice as quickly with BigPanda, saving $67,000 annually in associated labor costs (blue dollars).
SAVINGS in annual onboarding and training time costs
Cutting training time in half: “BigPanda helped us cut training in half, from six months to about three months. It also made onboarding the new team in India much smoother, with almost no need to travel.” —NOC Manager
Unquantified workload reduction and cost savings
While the current sample doesn’t include quantified data for these value drivers, customers consistently cite the following benefits of using the BigPanda platform (blue dollars):
- Reduced reassignment rates: By enriching alerts to provide the necessary context, tickets get assigned to the appropriate team or team member correctly the first time, improving workflow efficiency.
- Reduced incident escalations: Ultimately, routing incidents to the proper teams the first time saves enterprises time and money, freeing expensive engineering resources to focus on their primary responsibilities rather than troubleshooting routine issues.
- Improved employee experience, satisfaction, and retention: Lower employee turnover avoids the related loss of institutional knowledge and onboarding costs (hiring and training).
Providing AI-driven ticket guidance: “With BigPanda AI, we are making it easier for our L2 and L3 support teams to fix issues because each ticket includes the exact issue, suggestions to resolve it, and a note about the change that likely caused it.” —IT Operations Director
Customer feedback on reduced reassignment rates and incident escalations:
- Achieving measurable gains in MTTR and prevention: “We’re seeing real progress. Incidents are trending the right way. P1s and P2s are down about 15% and resolving about 20% faster year-over-year. That shows the observability work, including BigPanda, is paying off. We’re also catching more issues earlier at the P3 level before they escalate. When the right people engage in the first 10 minutes, MTTR drops by about 40%.” —IT Director
- Escalating faster to the right teams: “BigPanda has streamlined our escalation process. We can get tickets to the right engineering teams faster, without delay.” —Operations Director
- Auto-ticketing directly to resolvers: “With BigPanda auto-ticketing, we can get tickets straight into the hands of the people who will resolve them.” —IT Operations Director
IT spend reduction
Implementing the BigPanda platform can also help enterprises improve operational efficiency by replacing or reducing their IT spend, including software, hardware, infrastructure, maintenance, and third-party support services. The resulting IT cost reduction translates to green dollars.
BigPanda customers report IT spend reductions of up to $2.7 million annually, including examples outside the study sample.
For example, an enterprise customer reduced its annual IT spend by $284,000 through tool rationalization, including $110,000 from licensing costs and $174,000 from other IT expenses, such as maintenance, infrastructure, and contractors.
UP TO
SAVINGS in annual IT spend
BigPanda can provide additional value by helping customers evaluate the effectiveness of their monitoring and observability tools and identify those with low-quality alerts. It also provides visibility into how to improve alert quality and maximize the investment in observability and monitoring tools.
Additionally, customers report that better correlation, remediation, and deduplication with BigPanda reduces noise in popular ITSM tools, such as ServiceNow. Increasing the effectiveness and ROI of ITOps tech stacks translates to blue dollars. It also helps teams justify their spend and identify a higher return on that investment.
Avoiding costly PagerDuty upgrades: “We built a custom integration that uses BigPanda logic to identify the right on-call engineers instead of using PagerDuty add-on licensing to achieve the same goal. By preventing forced PagerDuty upgrades to support live call routing, we saved about $2.7 million per year.” —VP of IT Operations
Customer feedback on reducing IT spend:
- Consolidating tools to unlock savings: “We were being asked to cut operating expenses and consolidate tools. BigPanda ingests events across our tech stack, giving us the visibility to evaluate which monitoring tools to keep. We’ve consolidated from about 60 tools—spanning more than 500 applications—down to one, and redirected the savings toward higher-value work.” —IT Director
- Unifying data cost-effectively: “BigPanda gives us a cost-effective way to unify data from any monitoring tool into ServiceNow without vendor lock-in. Unlike single-vendor platforms that charge heavily for ingestion, such as Dynatrace, BigPanda is an aggregator that lets us add new collectors easily and scale at our own pace, making it a more sustainable long-term strategy.” —Systems Engineer
- Reducing PagerDuty license needs: “We experienced fewer escalations and bridge calls with BigPanda. We also used agentic AI to respond to alerts. These efficiencies meant we needed fewer PagerDuty licenses, which saved us about $250,000 per year.” —Operations Director
Outage impact reduction
The BigPanda platform can help enterprise ITOps and ITSM teams enhance service reliability by reducing the number and duration of major incidents, reducing service-level agreement (SLA) penalties, and improving customer satisfaction and retention. Maximizing uptime results in revenue protection.

Major incident duration reduction, avoidance, and revenue loss prevention
By reducing the number and duration of major incidents and outages, the BigPanda platform helps enterprises enhance service reliability, prevent revenue loss and internal costs from downtime, and ultimately protect revenue (teal dollars).
Three customer examples in Table 5 demonstrate how the BigPanda platform helped reduce the average duration or MTTR of major incidents by 72% to 90% (resolved 4x to 10x faster). Shorter durations prevented an estimated $1.9 million to $21.8 million in annual revenue loss.
UP TO
PREVENTION of annual revenue loss due to major incidents
| Enterprise customer | Major incident duration (MTTR) reduction rate | Major incident MTTR times faster | Annual major incident revenue loss protected |
|---|---|---|---|
| Customer A | 72% | 4 | $21,800,000 |
| Customer B | 81% | 5 | $4,400,000 |
| Customer C | 90% | 10 | $1,900,000 |
Table 5. Major incident duration (MTTR) reduction rate and revenue loss prevention with BigPanda (n=3; rounded values shown)
Transforming outage reduction: “There has been a huge reduction in major outages over the last couple of years—both in volume and duration—and this can be attributed to BigPanda. I’ve been at this game for over 20 years, and this is the first time I’ve had any real success in doing that. It’s really transformational and game-changing.” —IT Operations Director
Customer feedback on reducing or avoiding major incidents and preventing revenue loss:
- Auto-resolving the majority of incidents: “Just to put the numbers in context, about 80% of monitoring incidents come through BigPanda and get auto-resolved without anyone even touching them. The real value here is in avoiding outages altogether, and when that’s not possible, cutting their duration as much as we can.” —IT Operations Director
- Delivering best-ever year-end performance: “Since implementing BigPanda, this past year-end was our best period ever for major incidents—in both total count and impact. The BigPanda major incident tickets had a significantly lower MTTR than tickets created manually. We’re seeing real time-to-resolution benefits.” —Monitoring Engineer
- Proactively preventing outages: “BigPanda enabled about 40 preventative interventions, compared to about 200 handled manually, which shows its ability to stop incidents before they become outages. The next step is quantifying the impact by linking these prevented incidents to avoided transaction failures and the resulting cost savings.” —IT Manager
Unquantified outage impact reduction
While the current sample doesn’t include quantified data for these value drivers, customers consistently cite the following benefits of using the BigPanda platform:
- Reduced SLA penalties indicate that an enterprise has made tangible improvements to its incident management process to resolve incidents more quickly and efficiently. These improvements prevent breaches of customer/compliance SLAs, as well as the related costly penalties, translating to green dollars.
- Improved customer satisfaction and retention indicate that an enterprise has improved service reliability, reducing the impact of outages on customers. These improvements build trust and demonstrate reliability (satisfaction). They signify that customers are not just using a product or service, but are also highly satisfied with its reliability. This customer satisfaction, in turn, encourages them to renew (retention), translating to blue dollars.
Renewals are one of the clearest signals of the business value BigPanda delivers. Customers overwhelmingly choose to renew when financial savings are proven and communicated to decision-makers.
Driving retention as the ultimate metric: “Our performance is measured by five KPIs: customer acquisition, customer retention, revenue, cost of acquisition, and customer experience. In operations, we track availability and MTTR, but the real success is measured by its impact on customer retention. BigPanda helps by cutting down the noise, speeding up resolution, and giving us the visibility we need. All of that adds up to fewer disruptions and a smoother customer experience, which is what actually moves the retention number.” —Head of Infrastructure Operations
Business impact of the BigPanda platform
All of these benefits deliver a notable business impact for BigPanda customers. This section reviews the annual benefit value, ROI, and payback period based on quantified value drivers, as well as additional operational outcomes.
Annual benefit value
The annual benefit value of the BigPanda platform consists of the total quantified and annualized financial savings—including labor, ticket volume, MTTR, bridge call, onboarding and training time, additional headcount, existing IT spend, and major incident duration costs—for 22 customers.
annual benefit value 🟰 (sum of quantified benefits ➗ months of observation) ✖ 12
Figure 4 shows that the total average annual benefits ranged from $300,000 to over $25 million, with a median of $2.85 million.
- Most (59%) enterprise customers had annual benefits between $1 and $10 million, while three (14%) achieved transformational outcomes of more than $10 million.
- Nearly three-quarters (73%) received at least $1 million in annual benefits from BigPanda, including about a third (32%) that received $5 million or more.
- Even at the low end, every BigPanda customer sees at least hundreds of thousands in yearly value.
MEDIAN
in annual benefits

Figure 4. Total average annual BigPanda benefits (n=22)
Validating ROI and cost savings: “The BigPanda business value assessment confirms what we’ve experienced and known. We trust BigPanda is correlating alerts, saving us from duplicate work and looking at too many tickets. The value is understood and appreciated. It certainly backed up our assumptions and aligns with and validates what we see in our internal reporting. The ROI and cost savings it showed are exactly what we expected.” —IT Infrastructure Manager
Return on investment
Each customer’s ROI was determined by subtracting the annual BigPanda investment from the annual BigPanda benefits and then dividing that amount by the annual BigPanda investment.
annual ROI 🟰 (annual benefits ➖ annual investment) ➗ annual investment
ROI results across 22 BigPanda customers were consistently positive. The data show that enterprises of all sizes realize material returns with BigPanda, with several outliers demonstrating transformational impact.
Figure 5 shows the average ROI ranged from 40% to 2045%, with a median of 430%. In other words, on average, customers netted $430 for every $100 invested in BigPanda.
- Two customers achieved a transformational ROI of over 1000%.
- Most (91%) BigPanda customers realized an ROI of well above 100%, including nearly half (46%) that realized 500% or more, which is compelling.
- Even at the low end, all BigPanda customers saw a meaningful return on their investment.
MEDIAN
return on investment
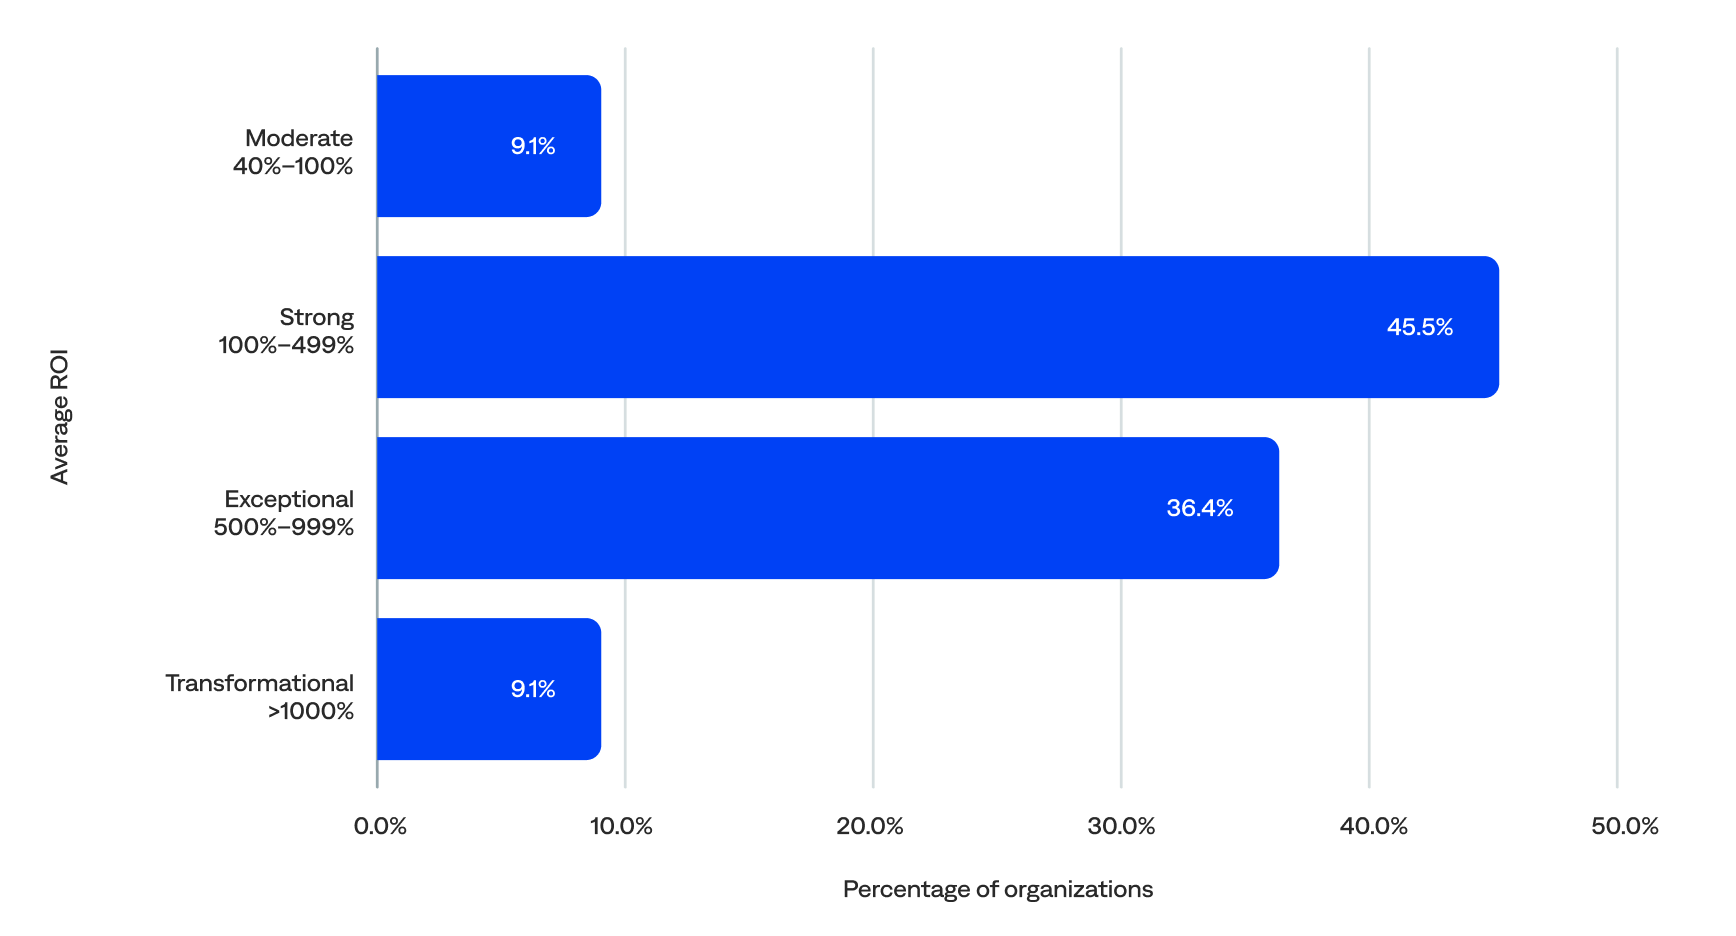
Figure 5. Average ROI for BigPanda customers (n=22)
Proving ROI through enrichment: “We were able to impact MTTR directly with enrichment. That really helped immediately prove the ROI of BigPanda. We saw an immediate decrease in customer complaints, and we were able to focus our energy on things that drive the business.” —Operations Manager
Payback period
Figure 6 shows that most (70%) BigPanda customers typically go live in three to nine months, with a median of about six months. This implementation time is fast by enterprise standards, especially for an event intelligence platform embedded across tools and teams.
LESS THAN
payback period
Figure 6. Implementation time for BigPanda (n=23)
Based on the implementation time and total year-one costs and benefits for three BigPanda customers, Table X shows that the payback period was less than a year, ranging from as low as seven months to 10 months. These findings indicate that BigPanda delivers rapid ROI.
| Enterprise customer | Payback period (months) |
|---|---|
| Customer A | 7 |
| Customer B | 7 |
| Customer C | 10 |
Table 6. Payback period for BigPanda (n=3; rounded values shown)
Additional operational outcomes
Customers have also reported operational outcomes that extend beyond the quantified benefits outlined in this report. While not formally measured in this dataset, these themes highlight potential areas of value, including:
- Improved data quality through increased alert correlation accuracy, faster and more informed incident triage, and enriched service desk tickets helps ensure that the data flowing into the incident management system is accurate, complete, reliable—and more actionable.
- Increased accountability and visibility for incident ownership, service health, and tool efficiency through enhanced root cause analysis (RCA) and better data enrichment help ensure operators can quickly pinpoint the right teams, reduce reassignment delays, identify recurring incidents to address systemic issues, and analyze which monitoring and observability tools contribute to actionable alerts versus alert noise.
- Increased innovation, predictability, and agility can be achieved through streamlining incident management processes and reducing the time spent on manual incident investigation, escalation, and firefighting. This efficiency helps teams free up valuable time and resources, enabling them to be more innovative, proactive, and agile, and focus on strategic, forward-looking projects.
- Stronger business-IT alignment through unified analytics dashboards and improved transparency enables a direct connection between IT performance and overarching business goals. This visibility demonstrates how investments in IT and AI directly contribute to financial success and key business objectives, linking technical metrics to business outcomes such as service availability and customer retention.
- Improved governance and risk mitigation through standardized, AI-assisted runbooks and proactive risk detection help provide clear ownership and step-by-step guidance. Centralized context speeds handoffs, reduces variance, and cuts compliance risk. With transparent audit trails and pattern learning (including root cause, resolution steps, and changes), teams can prevent repeat issues and reduce SLA breaches and end-user impact.
Prioritizing by business impact: “We’re maturing in how we measure IT performance to match how the business sees it. For example, if a server goes down but customers aren’t impacted, that shouldn’t be a P1. BigPanda helps us make that distinction by tying IT signals to real business impact. It’s a big step forward.” —Chief Operating Officer
Customer feedback on additional operational outcomes:
- Normalizing across tools: “Different tools often describe the same issue in different ways—Splunk says one thing, Dynatrace says another. BigPanda helps normalize and correlate those alerts so we can quickly see which backend service is actually impacted. That kind of consistency saves us critical troubleshooting time.” —Enterprise Monitoring Manager
- Centralizing in a single pane: “Before BigPanda AIOps, we had a lot of challenges. As a result of growth, we had multiple, scattered dashboards, and these disparate systems increased our MTTD. BigPanda centralized all those dashboards into a single pane of glass.” —IT Operations Manager
- Proactively detecting and preventing issues: “With BigPanda, we’re seeing all the precursor events before systems fail to get ahead of things, have a chance to remediate the problem, and create an automation to ensure it won’t ever happen again.” —IT Operations Director
Next steps on the path to value with BigPanda
Business value assessments highlight how the BigPanda platform enables enterprise customers to achieve transformational outcomes. Essentially, they show that it’s all about fewer and shorter:
| Fewer | Shorter | Financial benefit |
|---|---|---|
| Alerts | MTTD | Labor cost avoidance |
| Tickets | Incident triage time | Ticket volume cost savings |
| Bridge calls | Bridge call duration | Bridge call cost savings |
| Major incidents | MTTR | Revenue loss prevention |
| Tools and panes of glass | Maintenance and admin time | IT spend reduction |
Table 7. Financial benefits of reducing incidence and duration with BigPanda
They also help customers identify areas for further improvement. A big part of the assessment is assisting customers in extracting even more value from the platform through new and existing AI-assisted automation, troubleshooting, and prevention features for event and incident management. The business value typically grows over time, and customers indicate they’re inspired to build on their success.
Unifying knowledge with generative AI: “My team spends too much time jumping between systems—BigPanda for telemetry, ServiceNow for knowledge articles, and other places for functional docs. It takes too long to detect problems and get to RCA, and our SMEs are overloaded with hundreds of tickets. What excites me about Biggy and generative AI is the potential to unify all that information, accelerate resolution, and even add prediction. That would be a big help.” —IT Director
Business value assessments are available to existing BigPanda customers, and proof-of-value assessments are available for enterprises seeking to evaluate the potential impact of the BigPanda platform on their business.
Appendix
The following sections provide additional reference information to support this report. They include details on the BigPanda business value assessment methodology, data sources, definitions, and firmographics of the customer sample. This information is provided to give readers context, transparency, and clarity on how the findings in this report were developed.
About BigPanda business value assessments
A BigPanda business value assessment is a collaborative, customer-facing process tailored to each organization’s needs. Each custom assessment is meant to provide updates and insights, quantify key metrics, and provide a snapshot of the business value and impact of the BigPanda platform. These assessments help organizations justify their BigPanda platform spend, quantify their ROI, and identify areas for improvement.
BigPanda also conducts business value assessments with interested prospective customers who want to understand the potential impact and realities of an agentic ITOps platform.
Business value assessment methodology
The BigPanda business value services team works closely with key ITOps and ITSM stakeholders at each organization, as well as its BigPanda account management team, to conduct the assessments and present the findings to key executive stakeholders. The following members of the BigPanda business value services team conducted the assessments and contributed directly to the findings summarized in this report:
- Kamil Brozek, Vice President of Value Engineering at BigPanda
- Elad Golan, Senior Business Value Manager at BigPanda
- Westin Haas, Senior Business Value Manager, BigPanda
- Juan Serrano, Senior Business Value Manager at BigPanda
Their domain expertise and direct customer engagement were essential to the data used in this analysis.
The BigPanda business value assessment process they use is methodical and standardized, but flexible enough to meet customers where they are. The assessments typically take two to four weeks to complete and involve the following phases:
- Discovery: The BigPanda business value services team meets with key customer stakeholders to identify objectives, gaps, and decision criteria, and collects other data and qualitative details needed for the assessment.
- Creation: The BigPanda business value services team quantifies KPIs, conducts an ROI analysis, creates value maps, and identifies areas for improvement.
- Presentation: The BigPanda business value services team presents the quantitative and qualitative findings to the customer and collects feedback.
BigPanda value framework and definitions
The BigPanda value framework helps uncover areas customers want to explore. It focuses on cost reduction and avoidance, revenue protection, and risk mitigation, covering various types of data, benefits, results, and impacts.
Data types
This report includes quantitative and qualitative data about the business value of the BigPanda platform.
![]()
Quantitative data is expressed in numbers that can be measured or counted. It’s objective, can be analyzed statistically, and often answers how much, how many, or how often. Some data is measurable but cannot be quantified in financial terms. In other words, while some data can be measured, it does not translate into monetary value. Additionally, some data can technically be quantified but remains unquantified because the customer didn’t provide the necessary data.
![]()
Qualitative data is descriptive and non-numeric, capturing qualities, characteristics, opinions, or experiences. It’s subjective and typically gathered through interviews, open-ended surveys, or observations. It often involves categorization or thematic analysis.
| Quantitative data | Qualitative data |
|---|---|
| Observable / measurable | Not measurable (non-numeric) |
| Quantity | Quality |
| Numbers, leading/financial | Non-numeric stories/photos |
| Objective | Subjective |
Table 8. Data type comparison
Benefit and result types
The BigPanda platform’s value drivers fall into two primary benefit types: improved operational efficiency and enhanced service reliability, which result in either cost reduction and avoidance or revenue protection.

Table 9. Types of benefits and results
View all value drivers and benefits of the BigPanda platform.
Impact types
For quantitative data, the business impact of the BigPanda platform is classified into green, blue, or teal dollars.
| Green dollars | Blue dollars |
|---|---|
| ← Teal dollars → | |
| Hard dollars/value | Soft dollars/value |
| Measurable financial gain | Less directly measurable financial gain |
| Directly impacts cash flow/P&L statement | Indirectly impacts cash flow/P&L statement |
Table 10. Business impact types comparison
How BigPanda processes data
When reviewing the value drivers and benefits of the BigPanda platform, it helps to understand how BigPanda processes data.
Enterprise ITOps and ITSM teams use the BigPanda platform to detect events during pipeline processing, including:
- Correlating alerts across applications and services
- Enriching alerts for greater intelligence
- Minimizing alert noise and fatigue
Structured data is ingested into BigPanda as events from monitoring, observability, configuration management database (CMDB), and other tools, and is unified within the BigPanda IT Knowledge Graph. BigPanda compresses the events into alerts via deduplication and alert filtering, enriches them with additional context, and correlates related alerts into high-level incidents. Actioned incidents represent the outages and system issues that team members acted on, including opening an ITSM ticket.
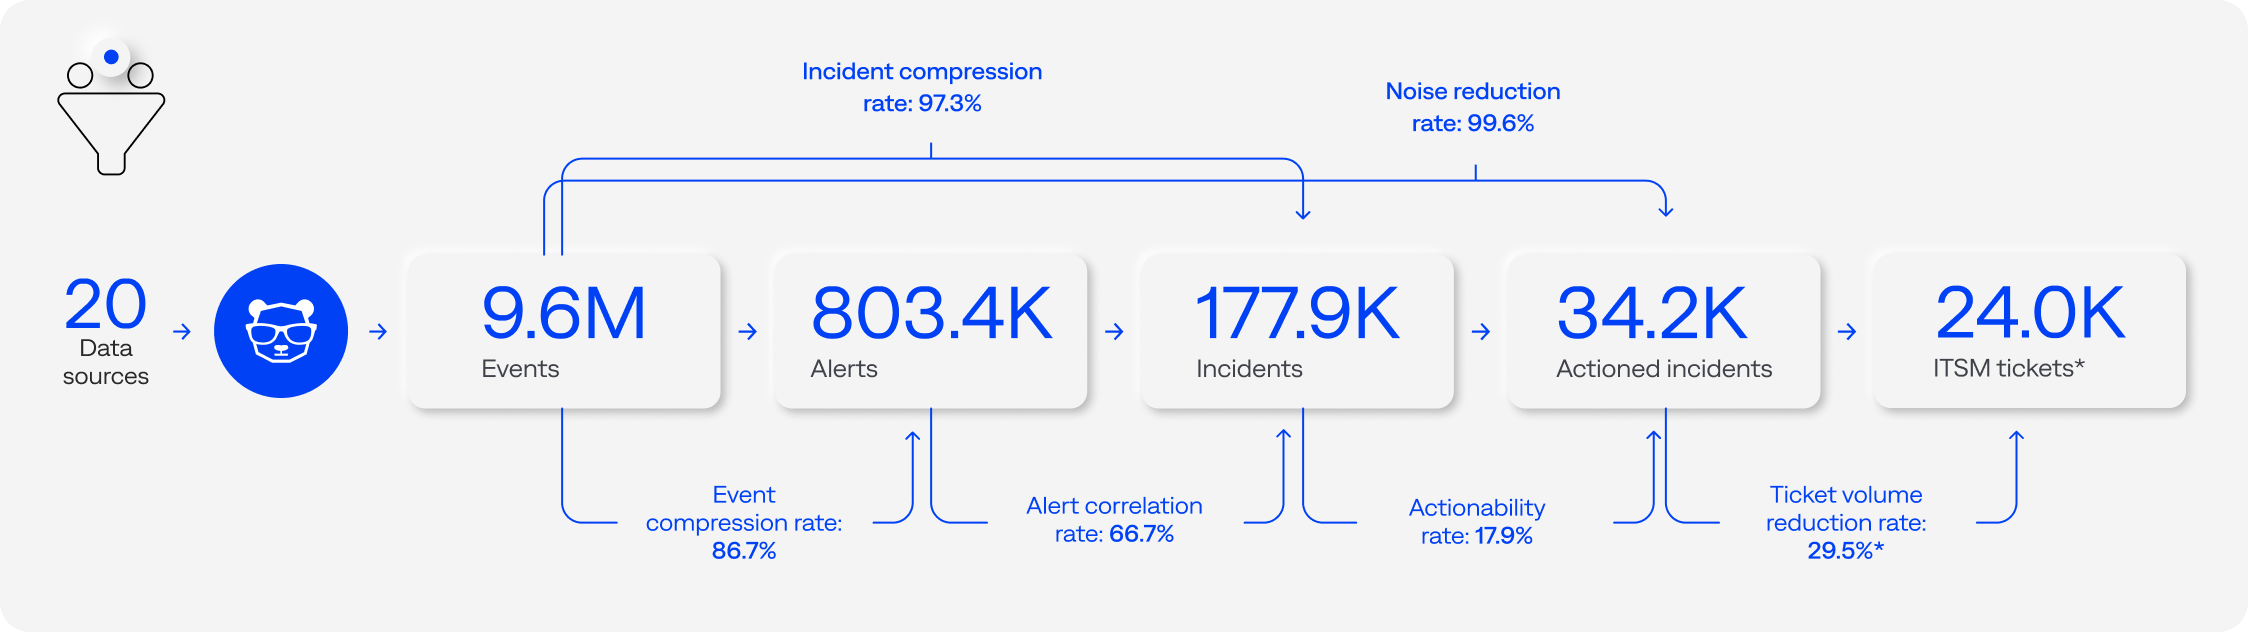
Figure 8. BigPanda pipeline processing funnel median detection benchmarks per organization (n=125; source) *estimate
This workflow enables IT teams to identify, triage, and respond to problems quickly before they escalate and reduces noise by up to 99.9%.
It also enables the BigPanda team to provide additional value by helping customers evaluate the effectiveness of their monitoring and observability tools for IT event management.
For example, the median ITSM ticket distribution and data for 17 customers show that BigPanda (49%) or other tools (6%) proactively generated over half (55%) of their ITSM tickets. Users, usually those in the service desk, retroactively generated the remaining 45%. This finding suggests that monitoring and observability tools failed to detect nearly half of all incidents. BigPanda uses this and other data to help customers rationalize their monitoring and observability tool spend.
Engaging developers in monitoring: “We actually have devs who get into BigPanda now and take an interest in their event flow. Nothing like that ever happened before. It used to be a black box.” —Monitoring Engineer
About this report
This is the first report to showcase the business value of the BigPanda platform based on quantitative and qualitative customer feedback.
Report methodology
This report was authored by Alicia Basteri, Principal Content Manager at BigPanda. It is based on quantitative and qualitative findings from business value assessments conducted by the BigPanda business value services team for 23 BigPanda customers between November 2024 and July 2025.
The observation period for each organization’s business value assessment ranged from two months to two years. Most organizations (87%) were observed for at least six months, including 52% for at least a year. The median observation period was 12 months.
Demographic and firmographic information is based on ZoomInfo data from March 2025.
BigPanda anonymized and aggregated the relevant data to give a general overview of the business value of the BigPanda platform. Any detailed information that could help attackers and other malicious parties was deliberately excluded from this report.
All quotes included in this report are based on customer feedback. While quantitative findings are limited to the defined sample, illustrative quotes may include insights from additional customers. All dollar amounts are in USD, and all data are based on UTC (Coordinated Universal Time), also known as GMT (Greenwich Mean Time).
To protect customer confidentiality, all customer-specific identifiers, including company names, detailed job titles, and potentially identifying operational metrics, have been anonymized or generalized in this report while preserving the substantive insights and business value outcomes.
Outliers usually skewed the average (mean), so the median was more representative of typical behavior and was used throughout the report. Aggregate medians are shown as calculated.
Citing the report
Suggested citation for this report:
APA Style:
BigPanda (October 2025).The Business Value of the BigPanda Platform. BigPanda. https://www.bigpanda.io/resource/report/business-value
The Chicago Manual of Style:
BigPanda (October 2025). The Business Value of the BigPanda Platform. BigPanda. https://www.bigpanda.io/resource/report/business-value
Demographics and firmographics
This report is based on business value assessments completed between November 2024 and July 2025 for 23 organizations using the BigPanda platform.

The study represents both new and loyal BigPanda customers. The time each organization had been using the BigPanda platform, as of the business value assessment completion date, ranged from approximately four months to over seven years. Most (83%) had been using BigPanda for at least a year, including 44% for at least three years and 17% for at least five years. The median time using BigPanda was 2.7 years.
Organization size
The BigPanda platform was designed for enterprise organizations, so all organizations included in this report were large enterprises. In fact, the typical organization in this study is significantly larger than the average enterprise.
Nearly two-thirds (62%) were on the 2024 Fortune 1000 list (US only), a third (33%) were on the 2024 Fortune 500 list (US only), and 17% were on the 2024 Global Fortune 500 list.
This underscores the ability of BigPanda to drive business value across some of the world’s largest, most operationally complex enterprises.
Annual revenue
All organizations had an annual revenue of at least $35 million. Over three-quarters (78%) had an annual revenue of at least $1 billion, including 57% with at least $5 billion, 39% with at least $10 billion, and 17% with at least $25 billion. The median annual revenue was $5.97 billion.
Number of employees
The median number of employees was 9,000. Nearly half (48%) of the organizations had 10,000 or more employees, including 26% with 20,000 or more and 17% with 100,000 or more employees. Less than a third (30%) had fewer than 5,000 employees, including 13% with fewer than 1,000.

Figure 9. Annual revenue per organization

Figure 10. Number of employees per organization
Regions
Most (91%) of the organizations included in this report had headquarters in North America, and 9% had headquarters in Europe.

Figure 11. Global headquarters locations

Figure 12. United States headquarters locations
Number of locations
However, most (91%) of the organizations included in this report have multiple locations, and many are global enterprises.
The median number of locations per organization was 23. Over three-quarters (83%) had at least five locations, including nearly half (48%) with 25 or more and one in six (17%) with 50 or more. Less than a third (30%) had fewer than 10 locations.
Industries
BigPanda delivers business value in nearly every vertical, including mission-critical, regulated, and customer-sensitive sectors. This study represents 10 industries, with a particularly strong presence in those where uptime, scale, and complexity are vital, such as financial services, insurance, technology, healthcare, managed service providers, and manufacturing.
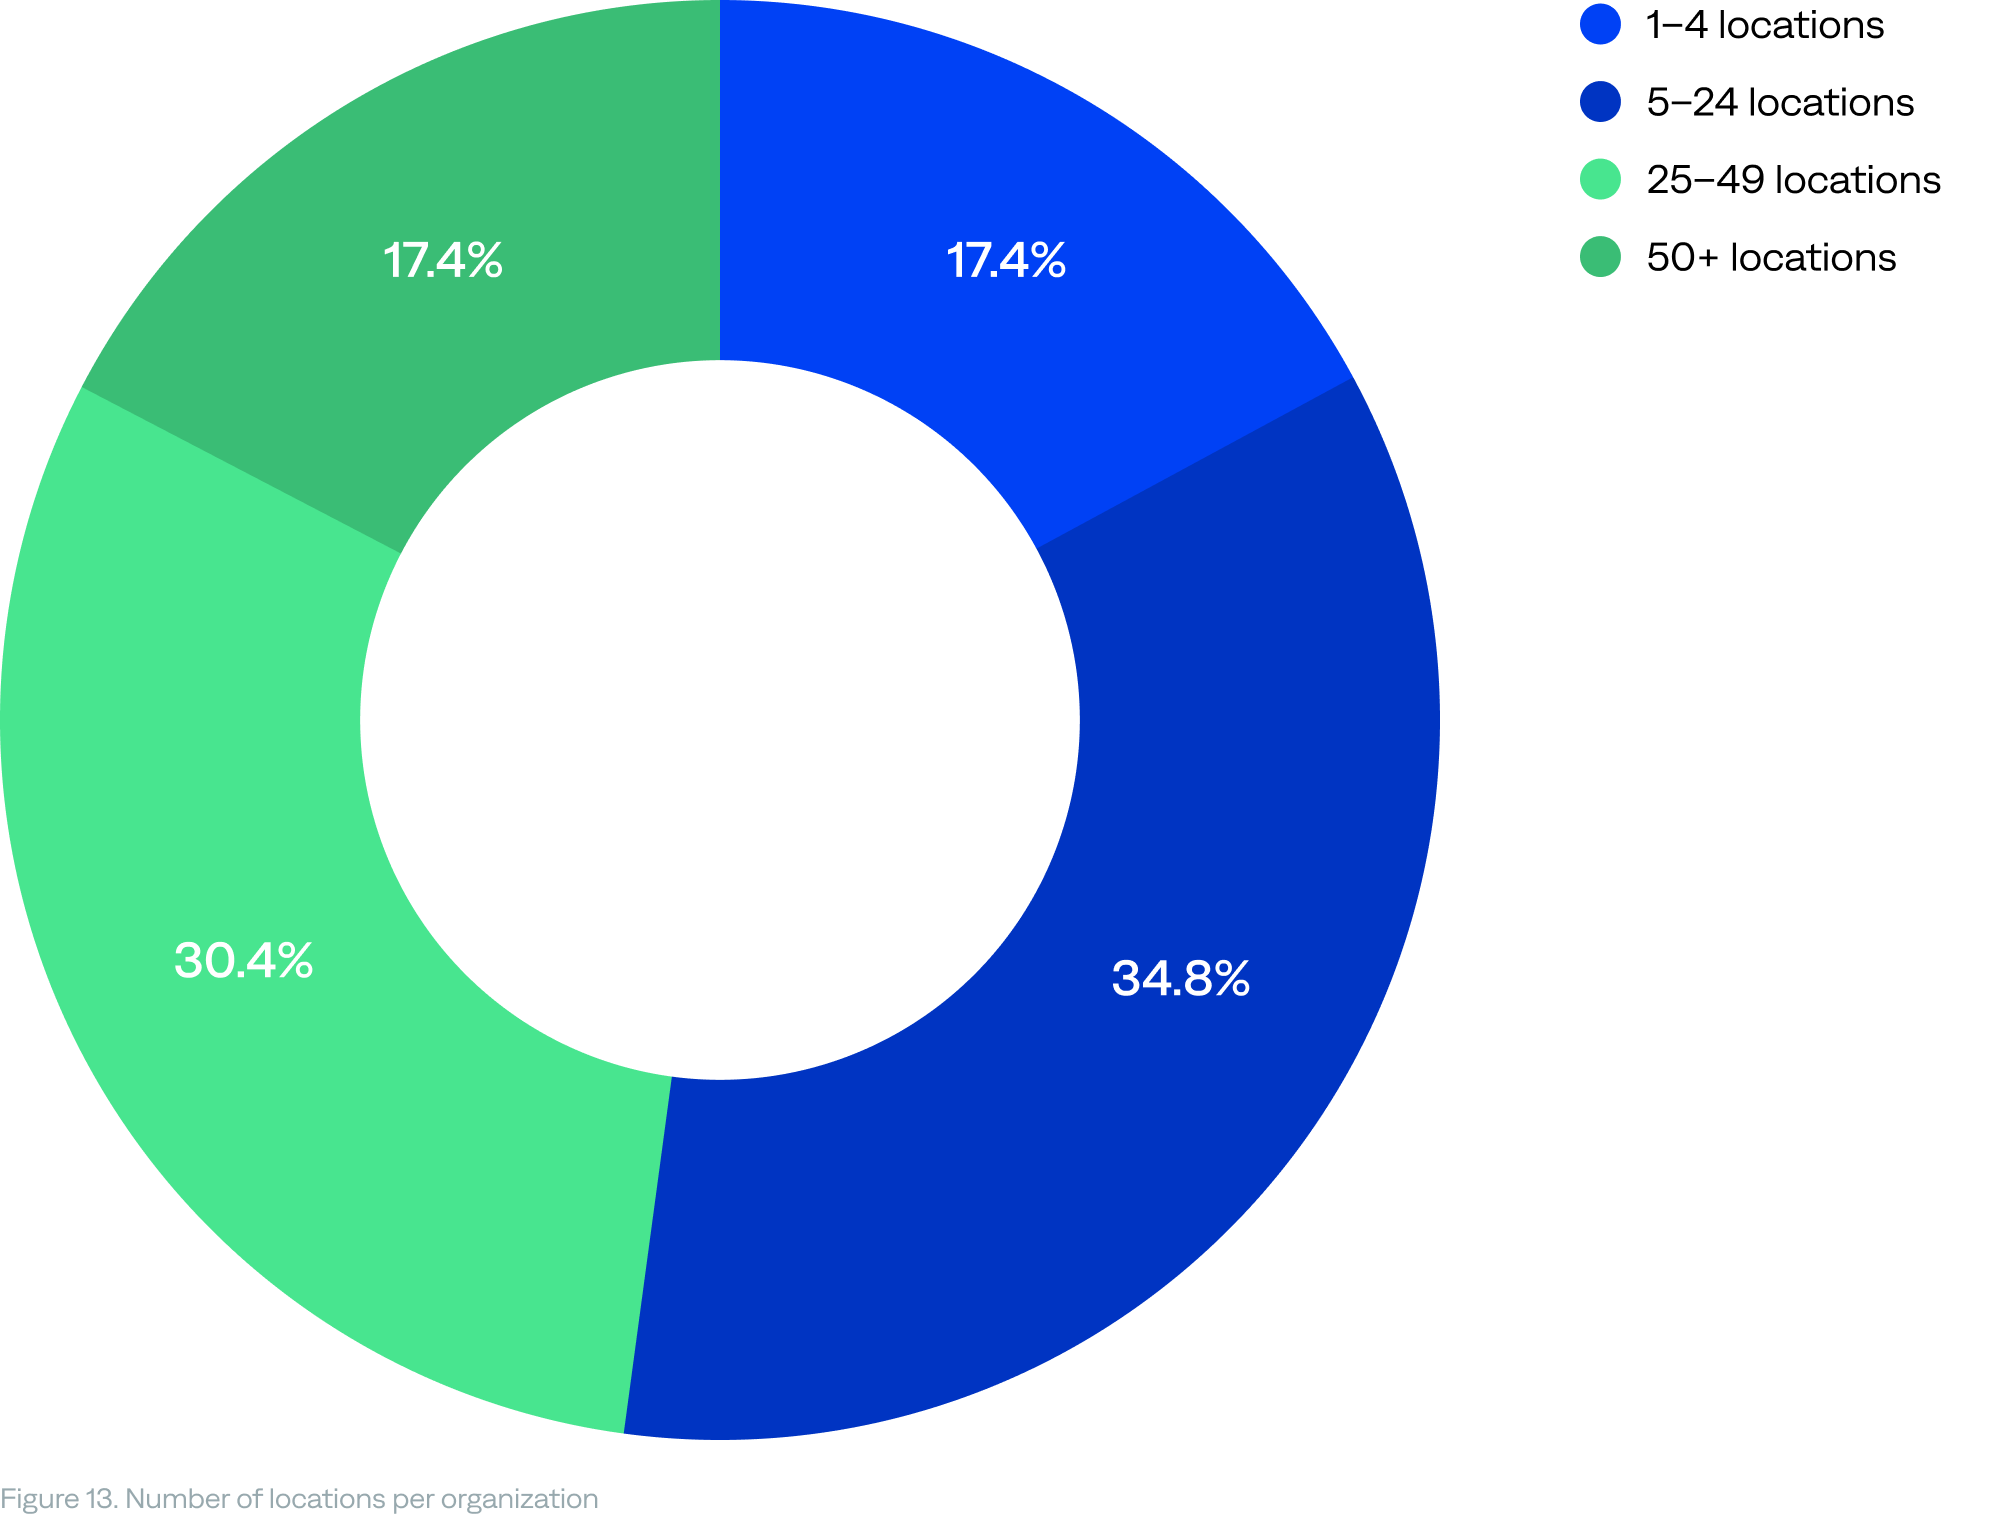
Figure 13. Number of locations per organization

Figure 14. Percentage of organizations in each industry
About BigPanda
BigPanda delivers agentic automation for ITOps. We enable enterprises to keep the digital world running by transforming manual, reactive human processes into intelligent, autonomous systems that detect, respond to, and prevent IT incidents at machine speed. That’s why the world’s most trusted brands rely on BigPanda to improve operational efficiency and deliver exceptional service reliability to their customers.

Figure 15. The BigPanda platform

- PlatformPlatform
- Agentic IT Operations
- Platform Overview
- AI Incident Prevention
- AI Detection & Response
- L1 Agent
- AI Incident Assistant
- IT Knowledge Graph
- BigPanda AIOps
- BigPanda Core
- Advanced Insight
- Biggy AI
- Rebranding Matrix
- Integrations
- Security & Compliance
- Features
- Detection
- Open Integration Hub
- AI Detection
- Diagnosis
- Service Desk Correlation
- Suggested Actions
- Incident Correlation
- Triage
- Automated Incident Triage
- Root Cause Analysis
- Similar Incidents
- Prevention
- Change Risk Management
- Problem Management
- Solutions
- Automating L1 Detection & Response
- Empowering Experts with AI Assistance
- Predicting & Preventing Disruptions
- Personas
- IT operations
- Incident management
- IT service management
- Site Reliability Engineering
- Industries
- Financial services
- Manufacturing
- Insurance
- Media and entertainment
- Managed services
- Airlines
- All industries