


What Is Root-Cause Analysis? How to Get the Root Cause Identified Fast

Root cause analysis (RCA) is a method used to find the main causes of a problem or event. Doing a root cause analysis is important in today’s fast-paced IT world. It helps us find problems, improve processes, and spot issues early.
In the past, tech and IT teams mainly used root cause analysis (RCA) as a post-mortem practice to improve processes. Today, these teams need to quickly find problems, automate solutions, and fix them at the source. This will help reduce their mean time to resolution (MTTR) and improve efficiency.
First, let’s explore how to use standard root cause analysis tools and techniques. Then, we will discuss how AIOps can automate the root cause analysis process for significantly faster, simpler incident resolution.
- Why are root cause analysis methods important for IT and Dev teams?
- What are the five steps of root cause analysis?
- How do you move from manual to automated root cause analysis?
- How BigPanda automates root cause analysis
Why are root cause analysis tools important for IT, ITOps, and Dev teams?
Using root cause analysis tools and techniques benefits IT, ITOps, and software development teams in three main ways. Specifically, root cause analysis:
- Precisely identifies issues and faulty processes
- Identifies the causes, not just the symptoms, to ensure that root issues are fixed
- Saves time and resources by catching problems early
In these ways, RCA empowers these teams to maintain an agile environment and improve processes. Regularly conducting RCAs helps to improve workflows, policies, processes, documentation, and eliminate known symptoms.
What are the five steps of root cause analysis?
There is no one-size-fits-all approach to root cause analysis methods. The key is to have a team use the right tools and techniques. This helps identify what caused the event. For your RCA, it’s important to understand the five-step root cause analysis process. This will help you assess, implement, and review the results correctly.
Step 1: Identify the issue to resolve and form your RCA team
The initial stage of the Root Cause Analysis procedure is recognizing and defining which issue to resolve. Compose a problem statement articulating the issue for everyone involved in the RCA process.
Once you’ve identified your main issue, you’ll need the right team to investigate and resolve it. Having someone on your team with experience doing an RCA at the same scale you’re working with is valuable. If not possible, compare methods and techniques and apply the latest best practices to ensure a successful RCA.
Begin by choosing a dedicated RCA Manager within each team to gather information to initiate RCA. Ideally, you’ll want to include members from cross-functional teams who are well-versed in the problem. Including people with different perspectives prevents groupthink and promotes independent thinking in the investigative team.
Step 2: Choose your root cause analysis method
There are multiple ways to conduct a root cause analysis and combine different Root Cause Analysis techniques. Here are some popular root cause analysis techniques used in the IT industry, from the most common to the least common.
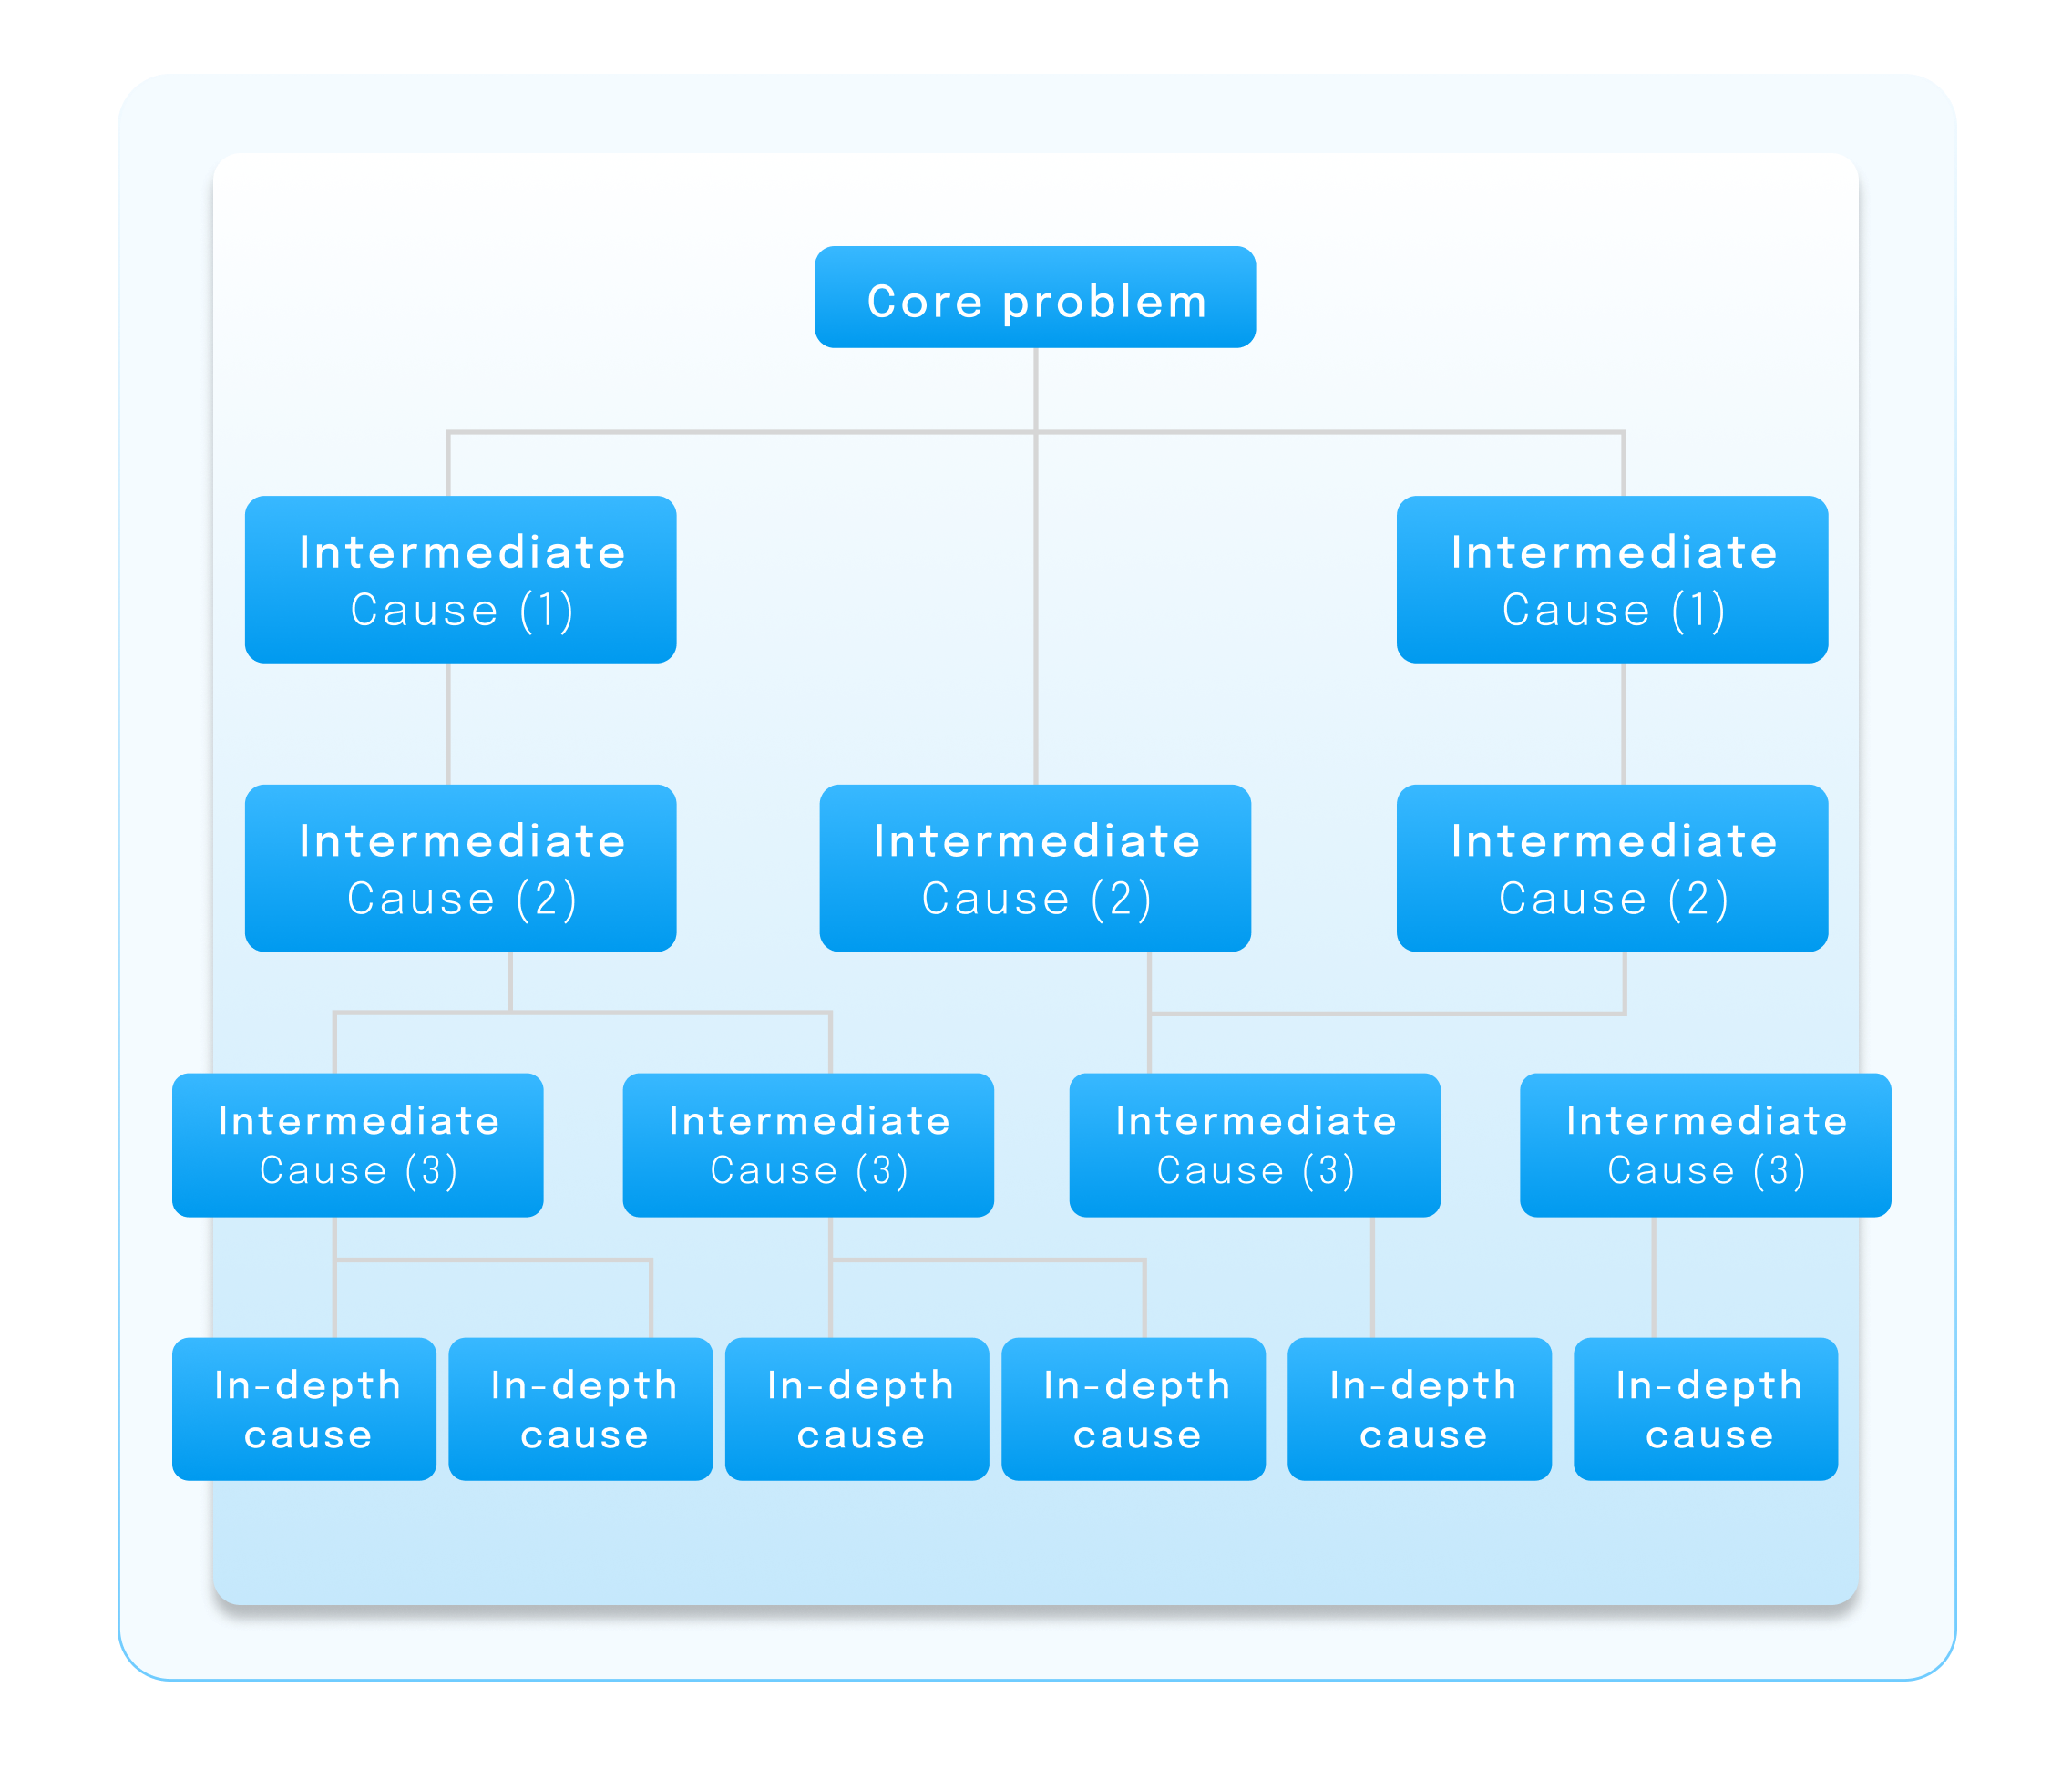
Causal factor tree analysis
Causal factors contribute to incidents. Causal factors range from complex factors to simple ones like a user failing to power on a machine. This method examines one event by creating a visual representation. The top level of the causal factor tree is the adverse outcome and the branches below represent the different possible causes. Drawing this lets us map causes from the incident to its underlying root cause. It also uncovers knowledge gaps, which change or barrier analysis can address.
Change analysis
This method focuses on how policy deviations, such as failing to use established procedures, lead to adverse outcomes. Change analysis provides clear steps for prevention. However, its effectiveness hinges on well-defined procedures and policies related to the incident.
Barrier analysis
Barrier analysis identifies the physical, procedural, or administrative failures preceding an incident. Simply put, it determines how a hazard was able to overcome barriers and whether existing barriers were missing or inadequate. Through this analysis, you can evaluate needed improvements to prevent future failures.
Risk tree analysis
Risk tree analysis finds the root cause to uncover potential failure risks and offers detailed insights. Begin by identifying what went wrong and list all the possibilities. Then, check each option one by one using the information until you can find the real reason. This analysis makes it easy to identify which pathway creates the highest chance of failure for a specific system. However, due to its complexity, it may occasionally overlook subtle differences and is recommended for experienced analysts.
Kepner-Tregoe method
The Kepner-Tregoe method, used by NASA on the Apollo 13 mission, gathers info and prioritizes problems. It assesses risk and finds efficient solutions for high-priority issues. Kepner-Tregoe aids decision-making, assigning responsibilities, and categorizing objectives to reach the minimum viable solution for top-priority problems.
Step 3: Determine which root cause analysis tools to use
There are countless RCA tools that you can combine with the above techniques as necessary. The “Five Whys” method is commonly used with a causal factor tree analysis. This method helps to map out the levels that lead from one factor to another. Here’s a closer look at the Five Whys technique and other standard tools you can apply.
The Five Whys
The “Five Whys” technique helps you understand the reasons that caused the problem you’re studying by asking questions and analyzing the effects. The first question tends to be very simple, but each subsequent “why?” forces you to get more specific.
For example, your problem is a department is unable to access their dashboard. Asking the first ‘why’ clarifies that those users were locked out of the system. But by continuing to ask ‘why’ again and again, you ultimately reveal the incident cause was a recently installed firewall. This firewall had overly restrictive settings that caused it to block legitimate traffic. This simple Five Why process gives visibility into the many contributing factors to an issue.
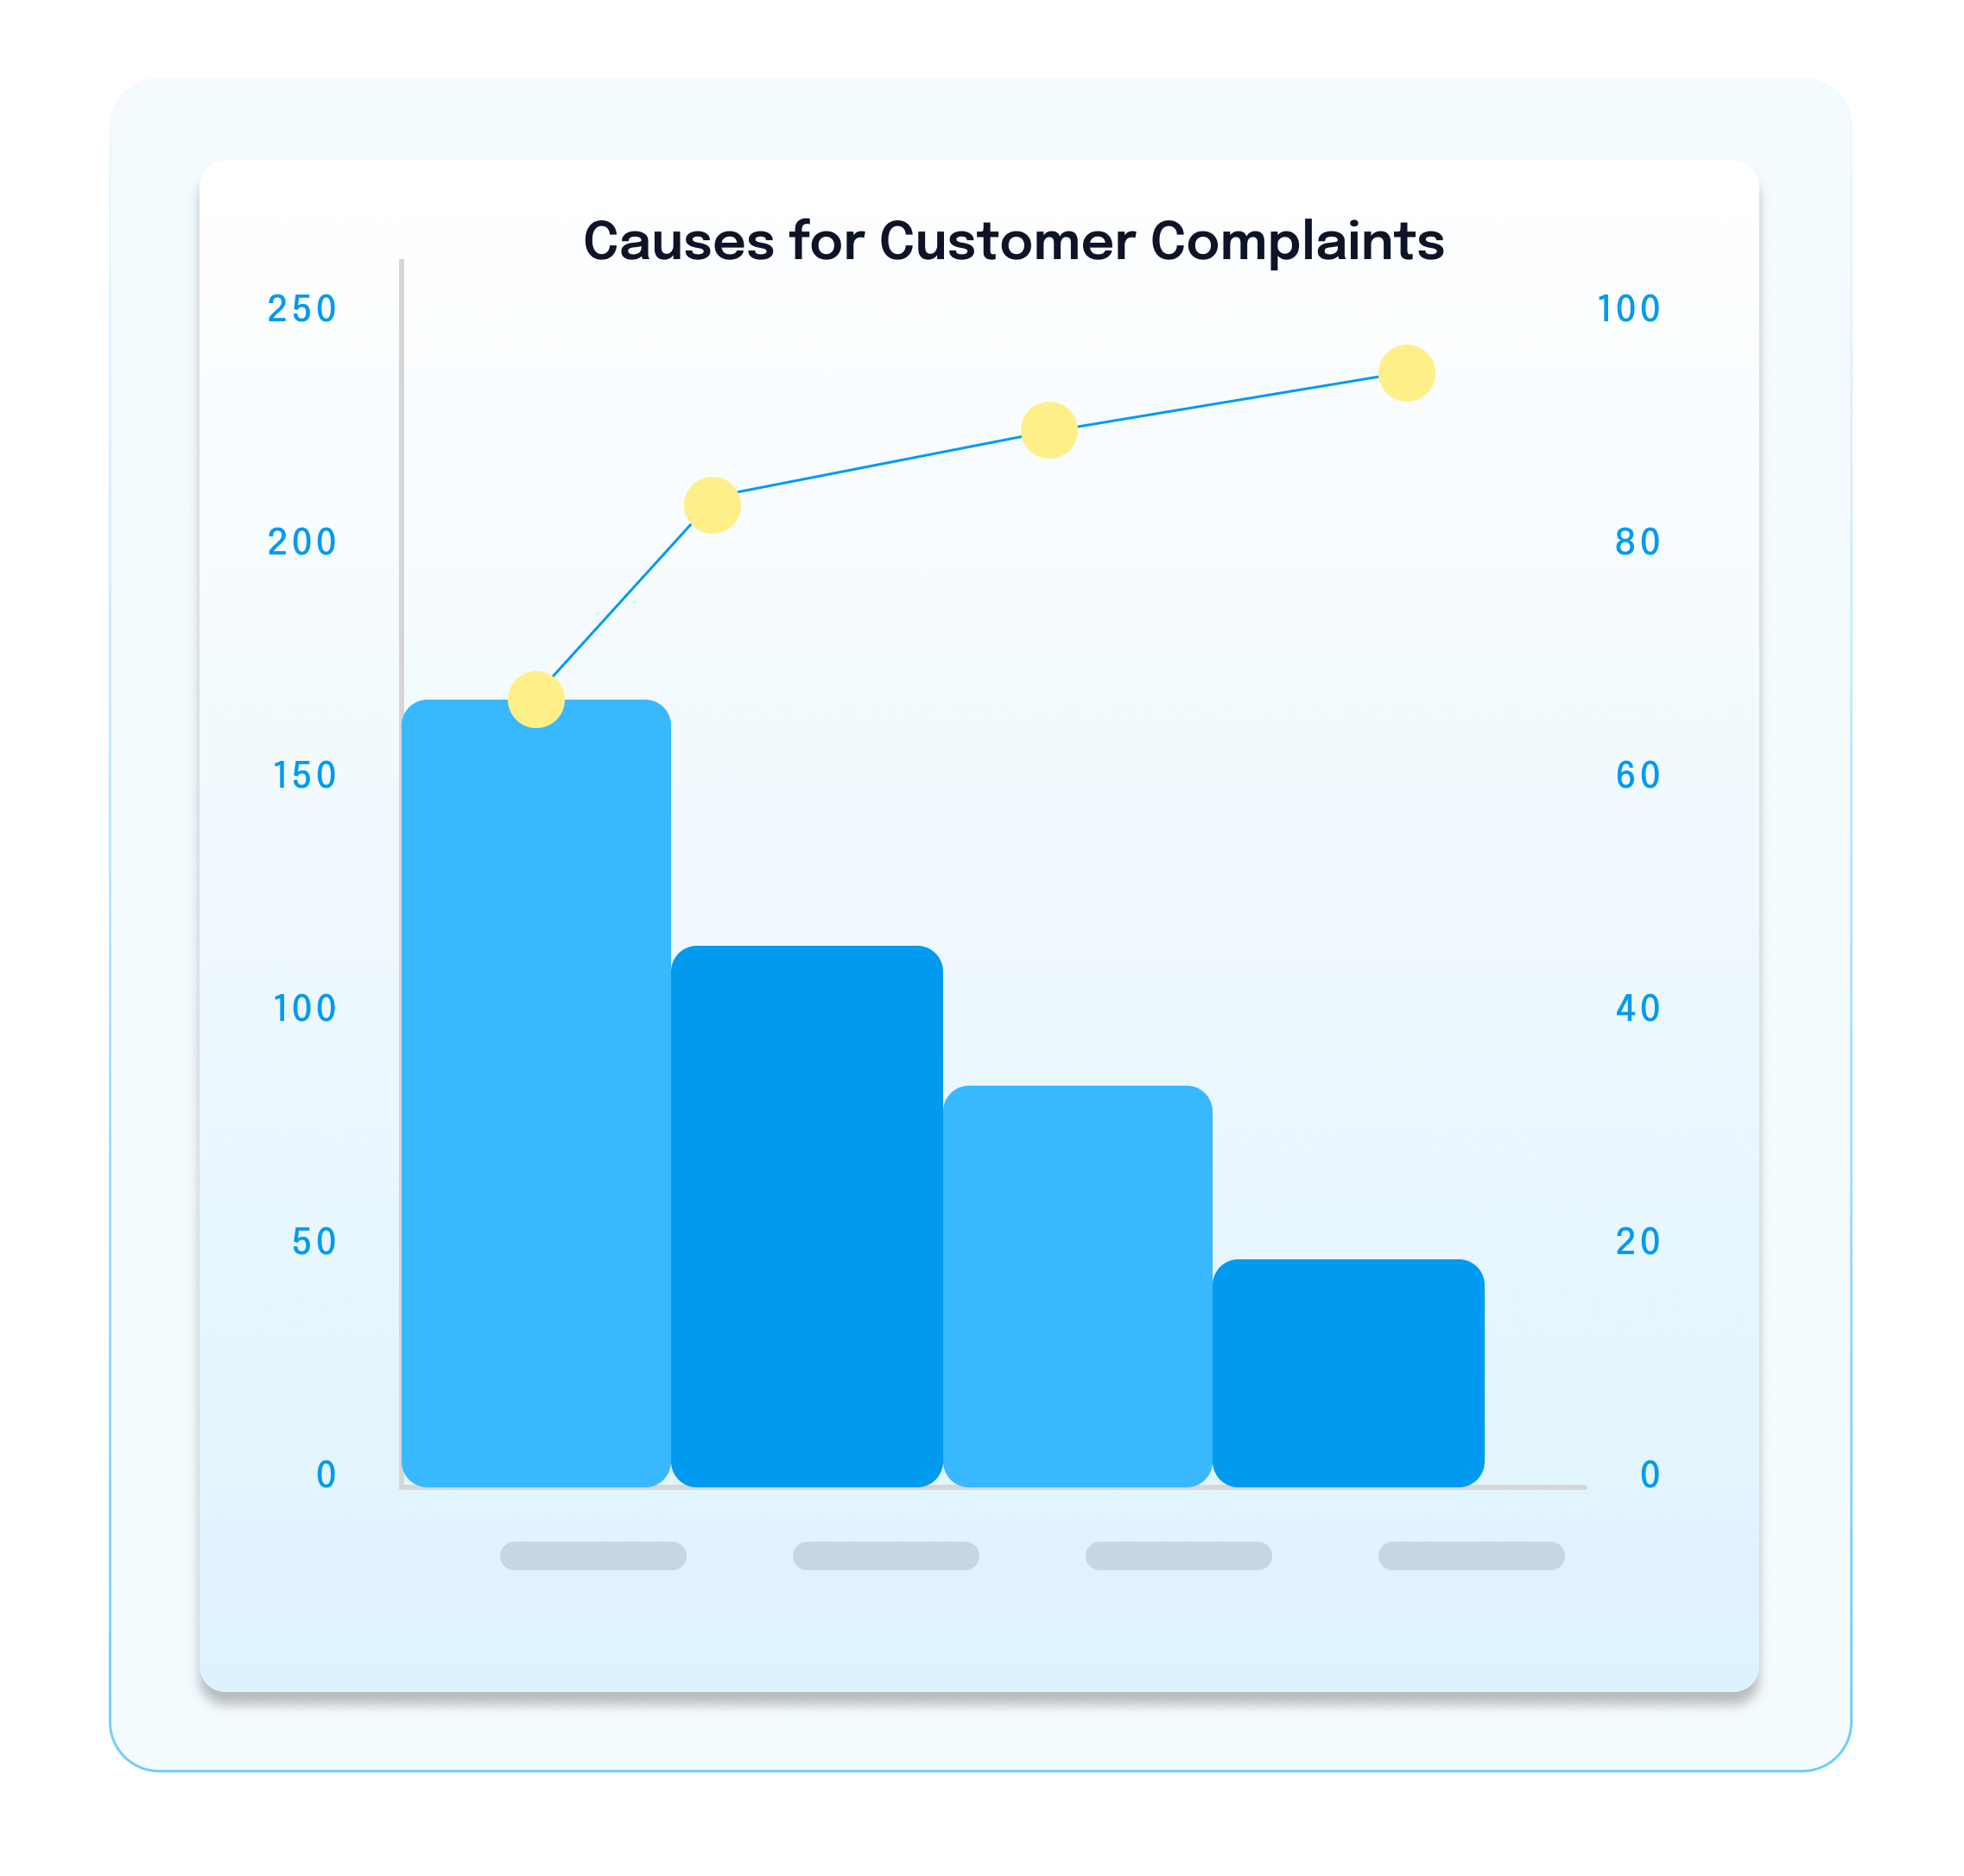
Pareto charts
A Pareto chart is a type of bar graph where the length of each bar represents either cost (in time or dollars) or frequency. The longest bars on a Pareto chart are always at the left, and the shortest are at the right, allowing your organization to see which situation or problem is the most impactful.
In root cause analysis, a Pareto chart can help you look at a lot of data at once and figure out which problems to work on first. After your investigation, you can also use it to decide what potential solution to prioritize.
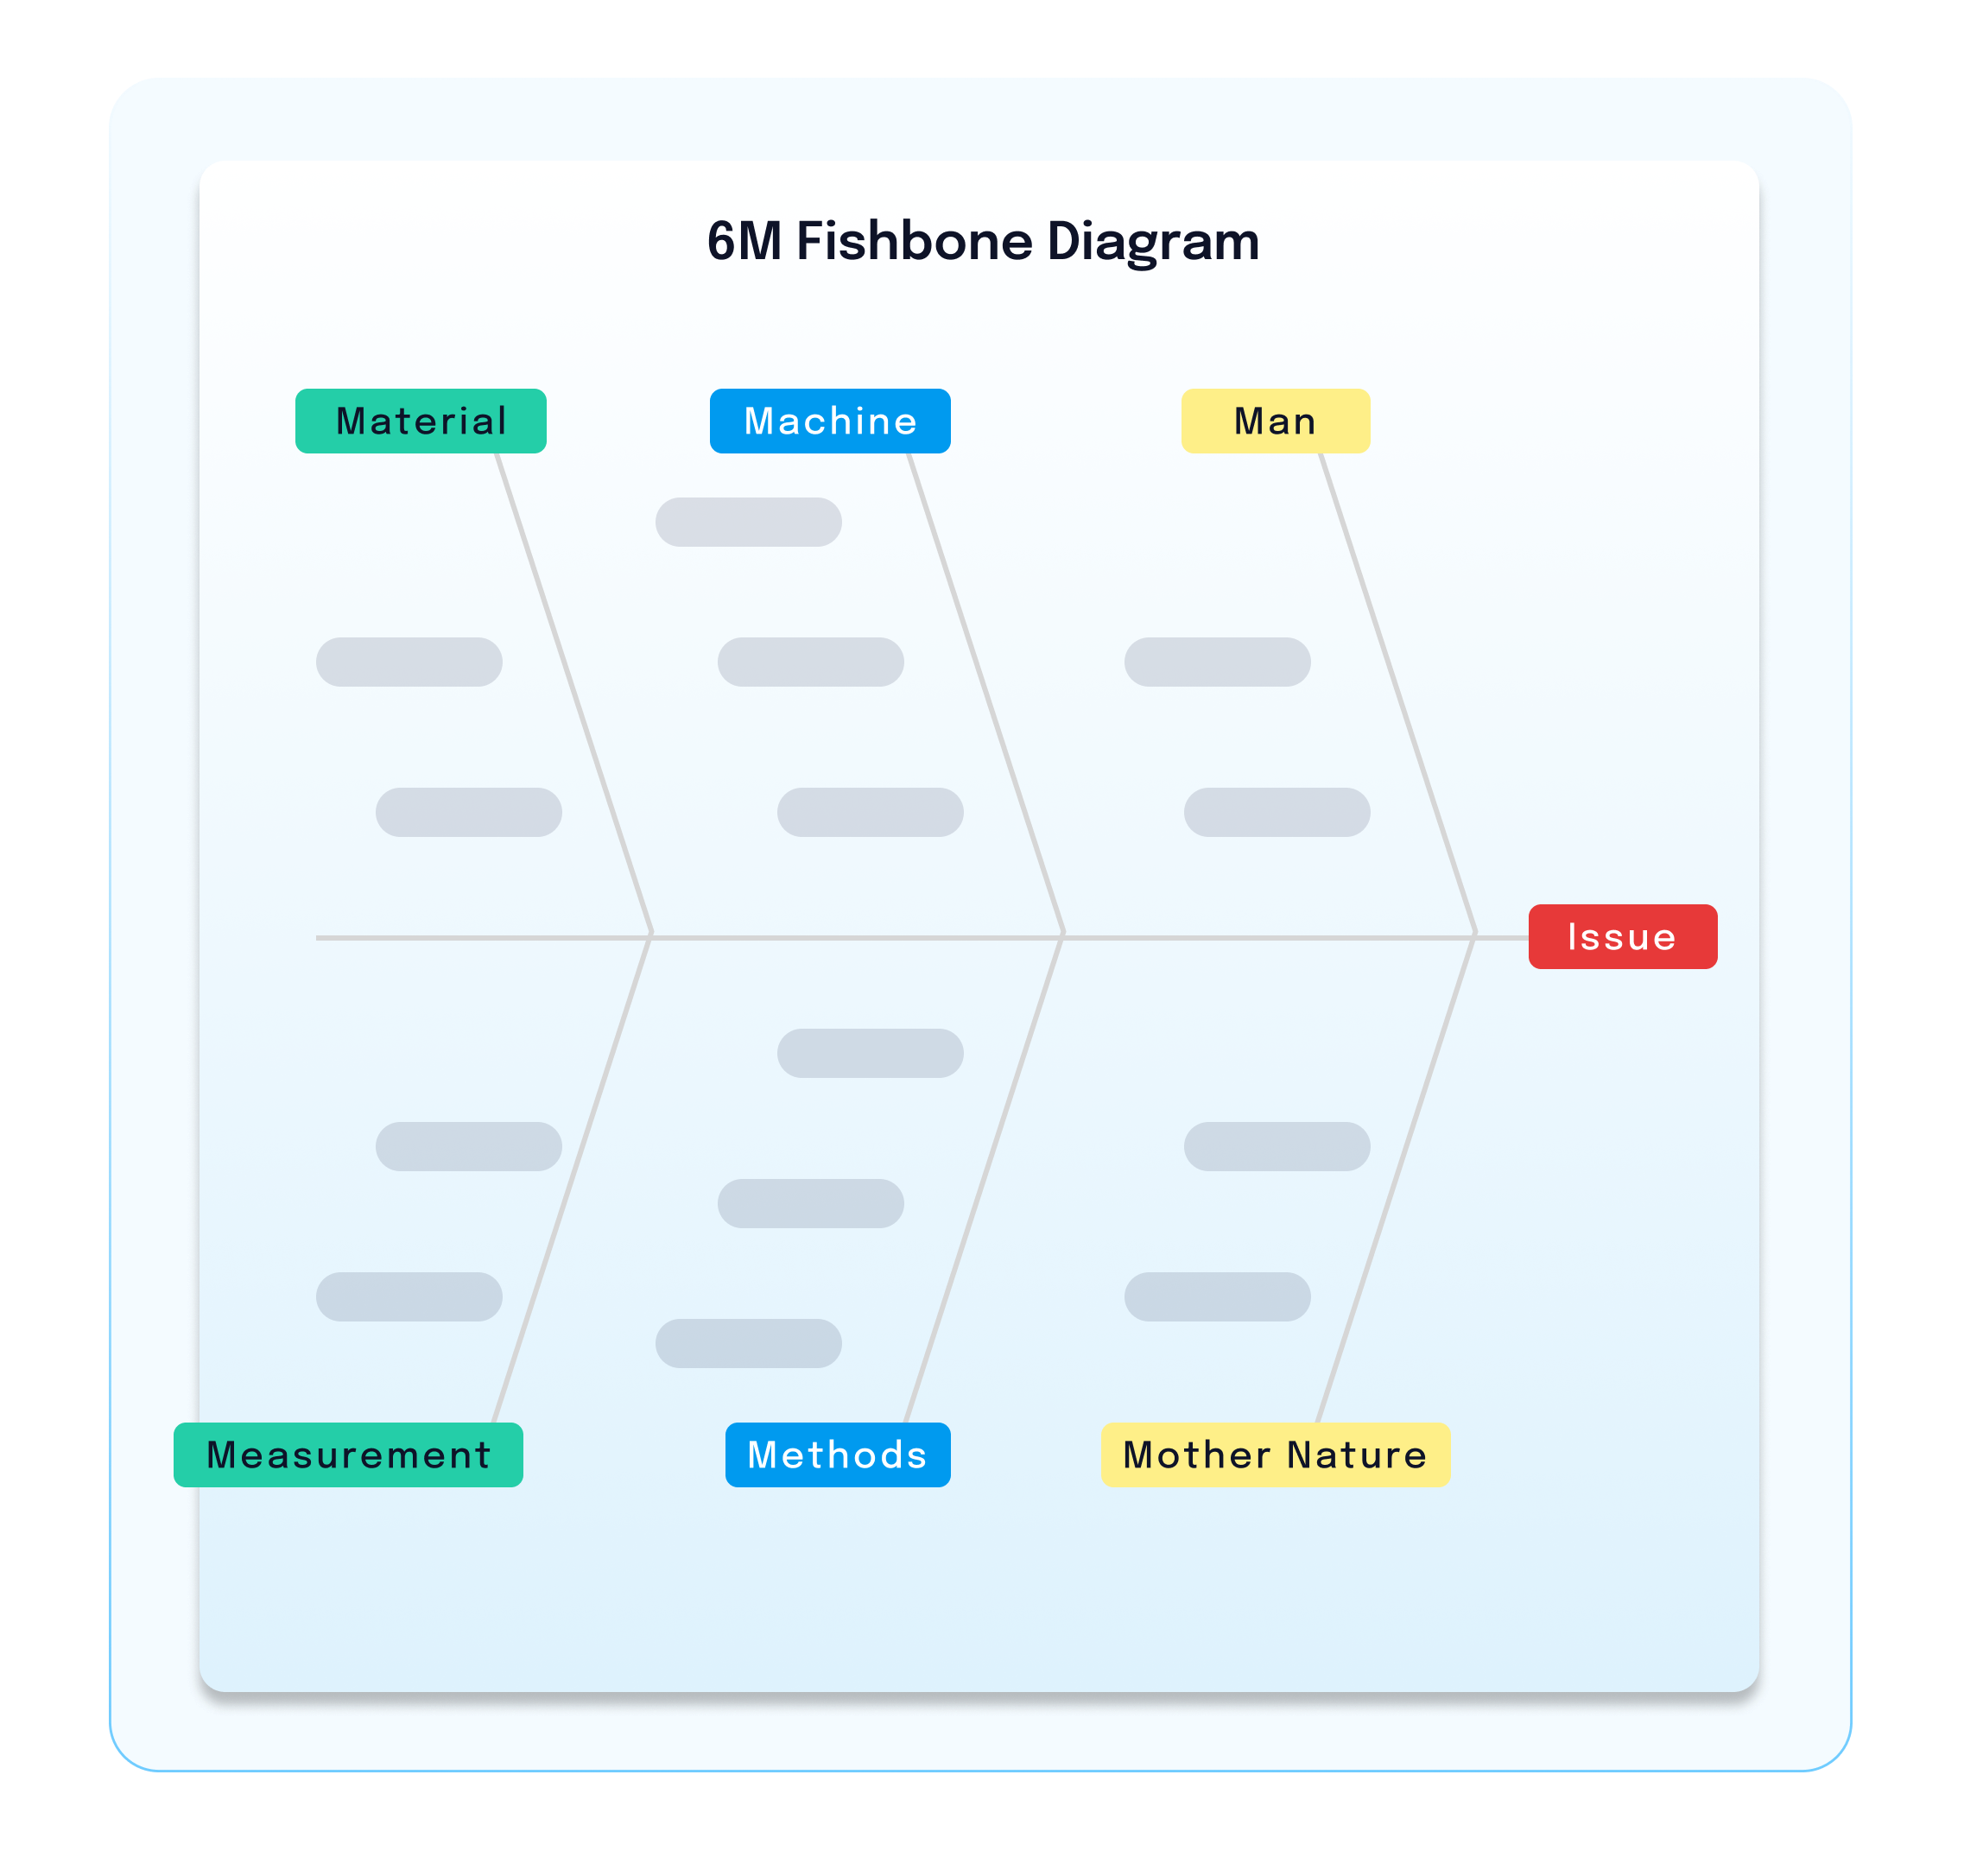
Fishbone diagrams
Fishbone diagrams, sometimes called Ishikawa Fishbone diagrams, illustrate your causes and their effects. This lets you dive deeper into the causes and sort them into categories. This model typically uses the 6Ms to identify the most probable root cause. These include:
- Man
- Machine
- Methods
- Materials
- Measurement,
- Mother Nature- i.e., Environment
These charts are often referred to as cause-and-effect diagrams and are helpful with unclear root causes and identify problems originating from multiple areas.
Scatter diagrams
Scatter plots show how two data sets relate to one another. For a root cause analysis, you plot the suspected root cause on the x-axis and the resulting problem on the y-axis. They might be related (i.e., correlated) if you see a pattern. While correlation doesn’t prove causation, it can help you quickly determine if you should look more closely at your suspected root cause.
Failure Mode and Effect Analysis
A Failure Mode and Effect Analysis (FMEA) can be used at any stage of the root cause analysis process. For Failure Mode, you identify how something can fail. Then, for Effect Analysis, you look at the failure modes’ effects. This helps identify the potential points of failure of your existing processes, policies, and procedures. While valuable to the RCA process, conducting a FMEA requires a team of cross-functional, expert stakeholders, which makes them somewhat resource-intensive.
Step 4: Identify your solution and implementation plan
No matter your root cause analysis tool or solution, it should prevent the problem from reoccurring. To do this, you must test your assumptions before implementing any solutions.
However, occasionally, your proposed solution may not solve the root cause. Then you may need to reconduct your analysis and determine if the true root cause was identified. Once your team is confident in the appropriate solution, they must create an implementation plan. Here’s how to create your RCA implementation plan:
- Prioritize improvements: First, put the most significant improvements at the top of your list. Decide which ones can cause the biggest problems if fixed later. Also, figure out what resources you need to make these improvements happen.
- Assign responsibilities: Next, decide who should oversee each improvement. Set a reasonable deadline for getting them done. Make sure there’s someone they can report to while working on implementation.
- Document the plan: Write down how you plan to make these improvements in your investigation report. If you discover anything new or change the plan, write that down too.
- Create a timeframe for RCA implementation: Depending on how big your organization is and how severe the problem is, it might take weeks or even months to finish all the improvements you came up with during the investigation.
Now that your RCA implementation plan is in place, it’s time to conclude your RCA by following the incident to its root causes.
Step 5: Conclude your RCA and create a culture of continuous improvement
Most IT incidents involve multiple causal factors. That’s why it’s crucial to trace incidents back to their actual root causes to successfully conclude your RCA. This prevents similar issues from occurring and creates a culture that focuses on problem-solving rather than pointing fingers.
While the RCA process may involve discussions that seem like blame-placing, it’s essential to have these to figure out what happened and why. Organizations should meet with individuals linked to the root cause to discuss what occurred and gain insights on prevention. Doing this with a positive, problem-solving focus creates a culture where incidents become learning opportunities.
You’ve now concluded steps one through five of your RCA. However, you’re not truly done until you follow up and confirm your identified Root Cause.
Step 6: Follow up on your identified root cause
A few weeks or months after implementing your RCA, you’ll want to follow up on whether your improvements to the identified root cause are working as anticipated. This allows your team to do the following:
- Assess the outcome of the improvements: Identify whether they have effectively prevented the incident from reoccurring.
- Identify the total cost and resources invested in the improvements: This allows for assessing the risk-reward equation.
- Finally, determine any gaps in the original solution or additional improvements needed.
Go from manual to automated root cause analysis
All these steps provide valuable learning opportunities for IT teams. However, automating your root cause analysis tools and techniques makes conducting RCA more accurate and faster too. Real-time RCA, conducted within minutes or seconds of an incident, is vital for reducing MTTR.
Failure to automate RCA forces responders to go through the time-consuming process of manually sifting through hundreds of thousands of IT alerts and change data to find and isolate the specific change across your infrastructure, network, or applications that caused services to degrade.
Quickly identifying root causes enables quick fixes and minimizes costly downtime. However, real-time RCA remains uncommon due to its complexity and resource demands.
That’s where BigPanda provides the solution. You can automatically reveal the root cause of incidents using advanced AI from BigPanda. That’s why our customers using Generative AI and Root Cause Changes report fast, accurate incident analysis and up to a 50% reduction in MTTR.
How BigPanda automates root cause analysis
Automate your RCA process with BigPanda to minimize incidents, simplify investigations, and roll-back faulty processes. With automated RCA, you can clearly describe incidents and their impact across distributed IT systems and see what caused them. Here’s how the BigPanda platform makes RCA fast and easy:
- Gain complete visibility into the entire timeline of each incident to pinpoint its origin and influencing factors.
- Centralize essential multi-source alert and change data into a single repository for accurate root cause attribution through a robust and open integration hub.
- Use Unified Analytics and new dashboards to make it easy to understand how to measure, improve, and operationalize root cause change investigation across all applications and services.
- Seamlessly deliver root cause insights directly within tickets in your preferred ITSM solution. A bi-directional integration with ServiceNow makes it easy for teams to automatically receive root cause insights without leaving the platform or your ticketing system.
Let BigPanda pinpoint the earliest symptoms and identify the issues and changes that may have caused them. Instead of burning hours on bridge calls, with BigPanda, you can immediately identify the root cause and take action. Discover how we do it in our ebook Three Ways To Simplify Root Cause Discovery, or schedule a demo to see BigPanda in action for yourself.