


Get started: BigPanda Incident Intelligence and Automation

If you’re in IT operations or manage NOC, SRE, and DevOps teams, chances are your IT environment is growing complex for you and your teams to manage. Any enterprise, large or small, around the globe, is continuously changing its IT stack due to evolving business requirements and significant industry trends. But digital transformation, hybrid infrastructure, DevOps adoption, and continuous integration and continuous delivery (CI/CD) pipelines are all causing major headaches.
Why? Because industry trends meant to modernize the IT stack and save costs ended up massively increasing the sheer number of problems for IT operations to track and handle. For example, microservices were created with the intent to break up a monolithic application into several granular functional services. This approach brought the flexibility of creating and decomposing resources at will, but the data generated by these resources can be substantially higher when under load. DevOps practices use CI/CD pipelines pushing thousands of changes every week. Any one of these changes could destabilize a service critical to business operations.
These are just a few examples, but the compound effect is a significant amount of IT noise that piles up and overwhelms the human capacity to focus on critical alerts. Noisy alerts carry siloed information, missing the real operational context that could assist incident response. These false positives create hundreds of support tickets burdening your ITOps teams. Dozens of subject matter experts (SMEs) or sometimes unrelated engineers are stuck on “bridge calls from hell” because of a lack of correct application or service context.
Therefore, when an incident occurs, IT teams keep jumping from one tool to another in an attempt to find critical information. They have to manually sift through thousands of alerts to investigate, triage, and route an incident. And they have to bounce incidents and tickets between different teams until they finally find someone with the power and knowledge to solve the issue. This slow, error-prone incident response sucks up precious hours when the teams can least afford it. What happens next? Increased downtime-related costs, increased MTTR violating critical business SLAs and negative customer experience.
What’s missing here is a first pane of glass for ITOps, NOC, DevOps, and SRE teams—a unified layer that brings all of your observability, topology, and change data into a single console. That’s where BigPanda’s Incident Intelligence and Automation powered by AIOps gets its name.
Contents
- Event normalization
- Monitoring integration
- Event deduplication
- Event enrichment
- Event filtering
- Event aggregation
- Alert correlation
Event normalization
Each monitoring tool can have a unique format and terminology to describe IT elements within an event. This makes it hard for ITOps teams to consume their data in a consistent manner and even more challenging for them to glean valuable insight from this data. Before integrating monitoring sources, users should have a list of common tag names they wish to use in advance. This makes normalization effective for enrichment and correlation.
For event normalization, two fundamental fields are important: the primary and secondary properties. These are used in normalization, deduplication, and correlation during incident management. Even though the secondary property is optional, as a best practice, ensure that both fields are configured. Use standard suggestions for the primary and secondary properties. This will aid correlation and deduplication further in the incident management lifecycle.
BigPanda normalizes all incoming events, adjusting tag values to enforce a standard structure. This creates a consistent taxonomy that increases alert quality and allows alerts coming from different sources to be compared and correlated.
Things to consider for event normalization:
- Before integrating with monitoring sources, BigPanda recommends planning the tag names in advance.
- Make sure all the tags used are common across multiple integrations for better enrichment and correlation.
- BigPanda will automatically present standard tag names and mapping suggestions. These recommendations are based on the BigPanda machine-learning engine and our deep knowledge of successful incident intelligence.
Monitoring integrations
BigPanda’s agnostic architecture automatically ingests raw events from any potential monitoring and observability source. Bringing all of your data in to create the first pane of glass is not only simple but absolutely necessary. Organizations looking to adopt the first pane of glass approach should start with this step.
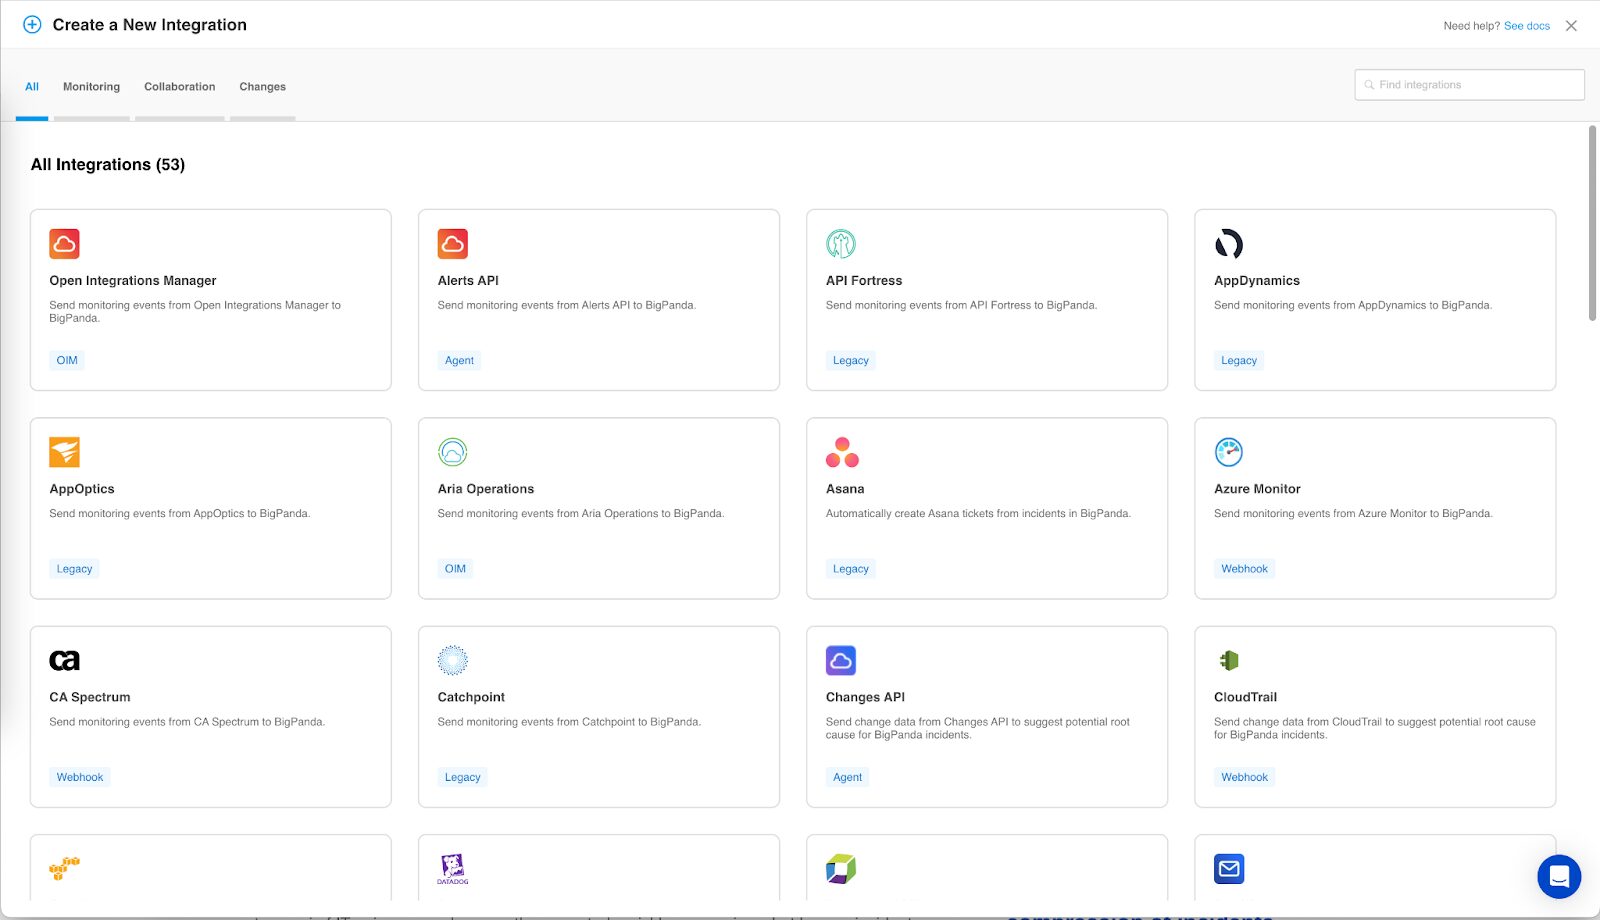
With more than 50 integrations available out-of-the-box, powerful REST APIs to support custom integrations via webhook, a parser for incoming alerts sent via email, and a simple network management protocol (SNMP) agent, BigPanda has the ability to integrate with almost any IT tool—commercial or homegrown, legacy on-premise or cloud.
Quick Tip: You can filter the list of available integrations by type by selecting the desired type at the top or by entering a search term in the top right. If you don’t see the tool you use, consider using the Open Integration Manager, Email Parser, or contact your BigPanda account manager.
Things to consider for all integrations:
- Integrate monitoring sources first over other integration types so that you can analyze and manage your events from within the BigPanda UI. This should give a good sense of actions you need to perform or automate in order to get to the desired state during incident management.
- Review integration instructions and requirements for your tool in advance to identify the tool version and ensure it is compatible with BigPanda.
- If integrating a monitoring tool, ensure it has the ability to send outbound event notifications.
- Check that the tool has access to the internet for outbound event notifications.
- Ensure all security requirements (such as whitelisting) are met to send traffic outside the core network.
Integrating using the Open Integration Manager
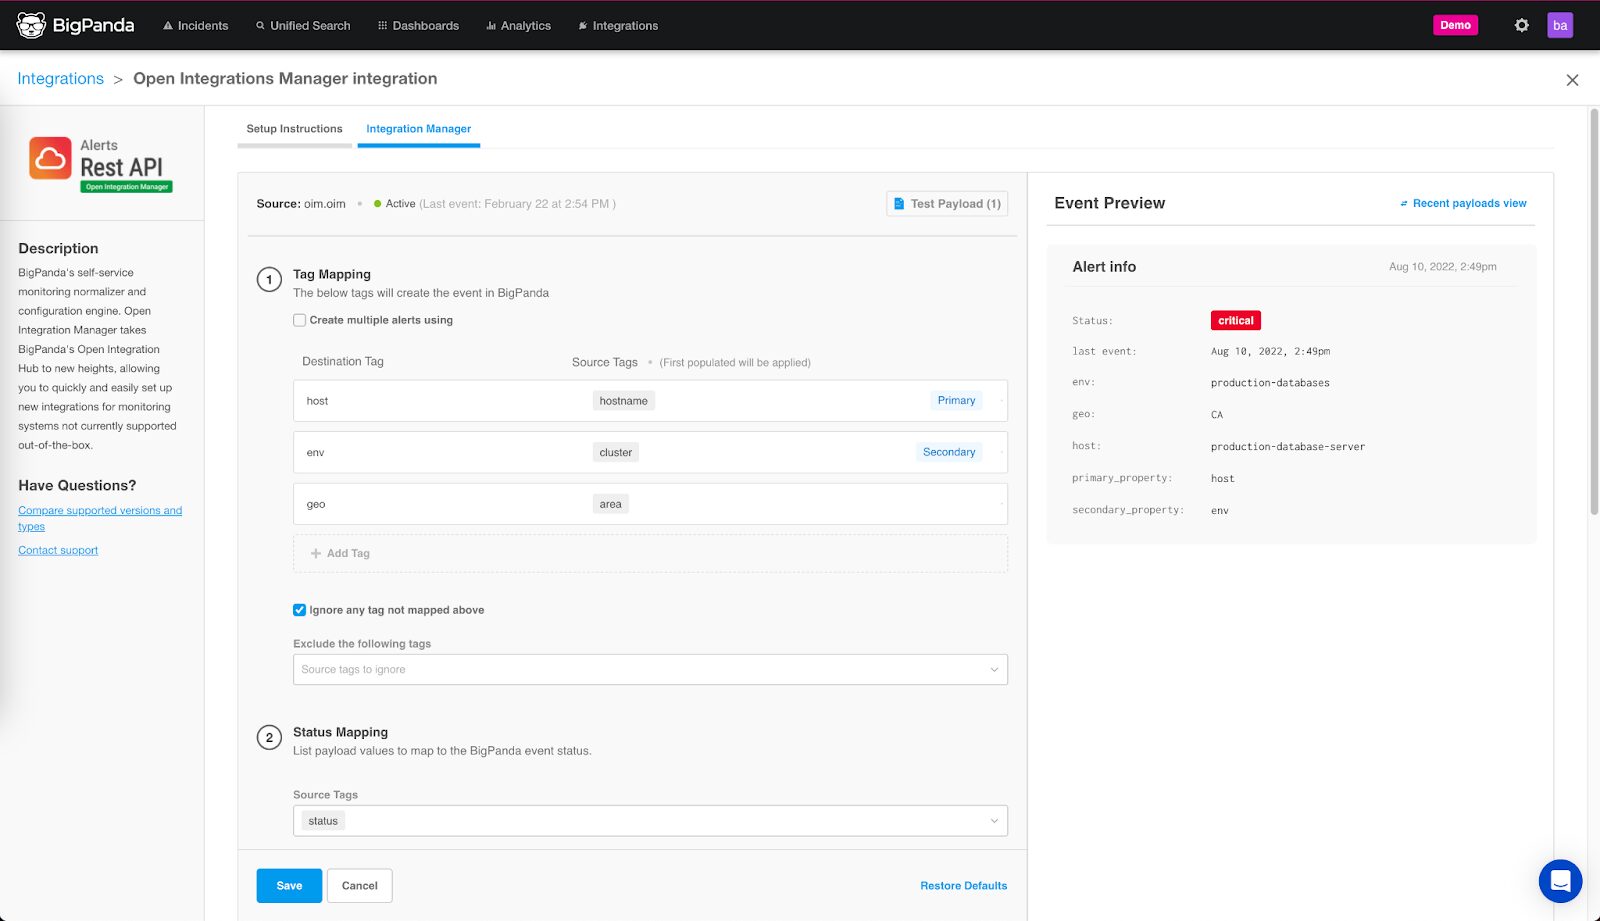
The Open Integration Manager (OIM) provides an intuitive user interface where users can easily pre-process and normalize alert data sent to our Alerts API without the need for custom code. With this self-service capability, users are able to configure, test, and deploy existing out-of-the-box inbound integrations on their own directly within the BigPanda user interface.
Things to remember:
- After creating an OIM-enabled integration in the BigPanda UI, wait five minutes before sending alerts via the integration. Alerts sent immediately after saving an integration within the UI may not be successful.
- Removing a tag suggestion will clear all BigPanda suggested tags for that field. We recommend using one of the suggested tags whenever possible.
- BigPanda cannot receive events without a primary_property.
- We recommend testing configuration changes using test alerts and the preview panel before finalizing changes to an integration configuration.
- We recommend keeping the default setting for the incident identifier. Changing this setting can create a mismatch between alerts reported through different integrations and may result in duplicate incidents or alerts that fail to resolve appropriately.
Integrating using Email Parser
The BigPanda Email Parser is a streamlined, simplified integration to extract alert data from emails without custom code. Ideal for monitoring tools and systems that do not support our REST API, the email parser extracts alert data such as status and properties right from the email’s subject or body.
Things to remember:
- A unique email parser must be configured for each source that will be sending emails to BigPanda.
- By default, the three extraction rules can only be customized but cannot be deleted.
- Use the sample email pane to preview and configure extraction rules for the parser easily.
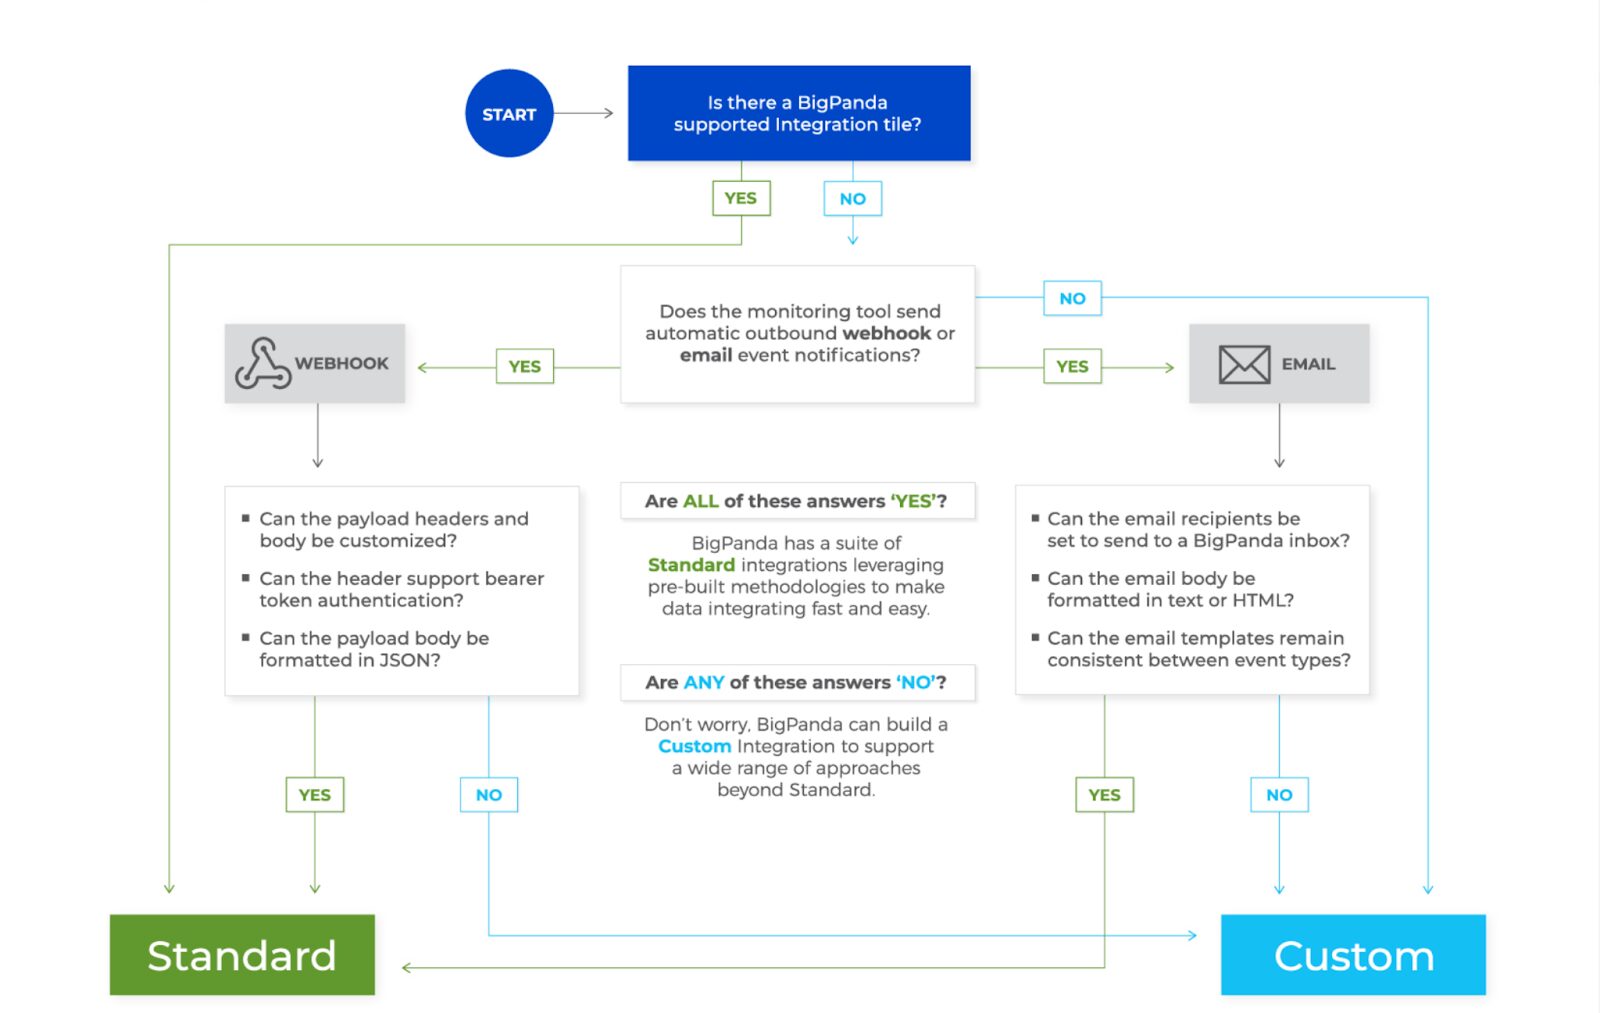
Custom integrations
For tools that aren’t supported using standard approaches, BigPanda can build custom integrations to support a broader range of monitoring tools and capabilities. Custom integrations may be needed for complex tools with advanced logic requirements.
Use the below flow diagram to determine the integration approach.
Things to consider for custom integrations:
- Standard integrations are preferred over custom. BigPanda standard integrations offer simple approaches to integrating your monitoring stack into the event pipeline. While custom integrations can offer additional flexibility, changes to the integration must be made by the BigPanda team, which reduces visibility and makes ongoing updates a challenge.
- Leverage push, not pull approaches. Push approaches from monitoring tools are the most efficient way for BigPanda to ingest events. Pull solutions rely on a recurring, which adds additional time until an event can be viewed and actioned. Pull solutions have increased maintenance and security costs over time as they are inflexible for updates and changes.
- Focus on actionable events. BigPanda is designed to cut through the noise and highlight high-priority issues from your monitoring tools. Reducing volumes is best done as early as possible in the pipeline. If there’s no value to be had from an event in BigPanda, don’t send it.
- Enable event resolution. Monitoring tools can trigger notifications when a problem has been resolved, saving you time by allowing you to focus on current issues. BigPanda can automatically move the alert to a resolved state once received.
Event deduplication
BigPanda intelligently reduces noise by parsing incoming events to recognize duplicates or updates to existing alerts, which are discarded or merged. This process is known as event deduplication and is critical in removing redundant data to reduce noise and simplify incident investigation.
Whenever two or more events arrive with a similar payload, this is what happens:
| Scenario | Action |
|---|---|
| The event payload (including the application key, timestamp, and primary and secondary properties) exactly matches an event that was already received. | The event is dropped. |
| The timestamp (or any other value in the event payload) has changed, but its status (ok/warning/critical) has not changed. | The event is merged with the previous event into a single alert updating with the tag values from the new event. |
| The event payload’s status has changed from the previous event. | The event is added as a new alert. |
Things to remember for event deduplication:
- During the removal of redundant data, BigPanda creates an incident identifier for the incoming event by default using primary and secondary properties.
- The primary and secondary properties are key fields used for deduplication and correlation in the further stages of incident processing.
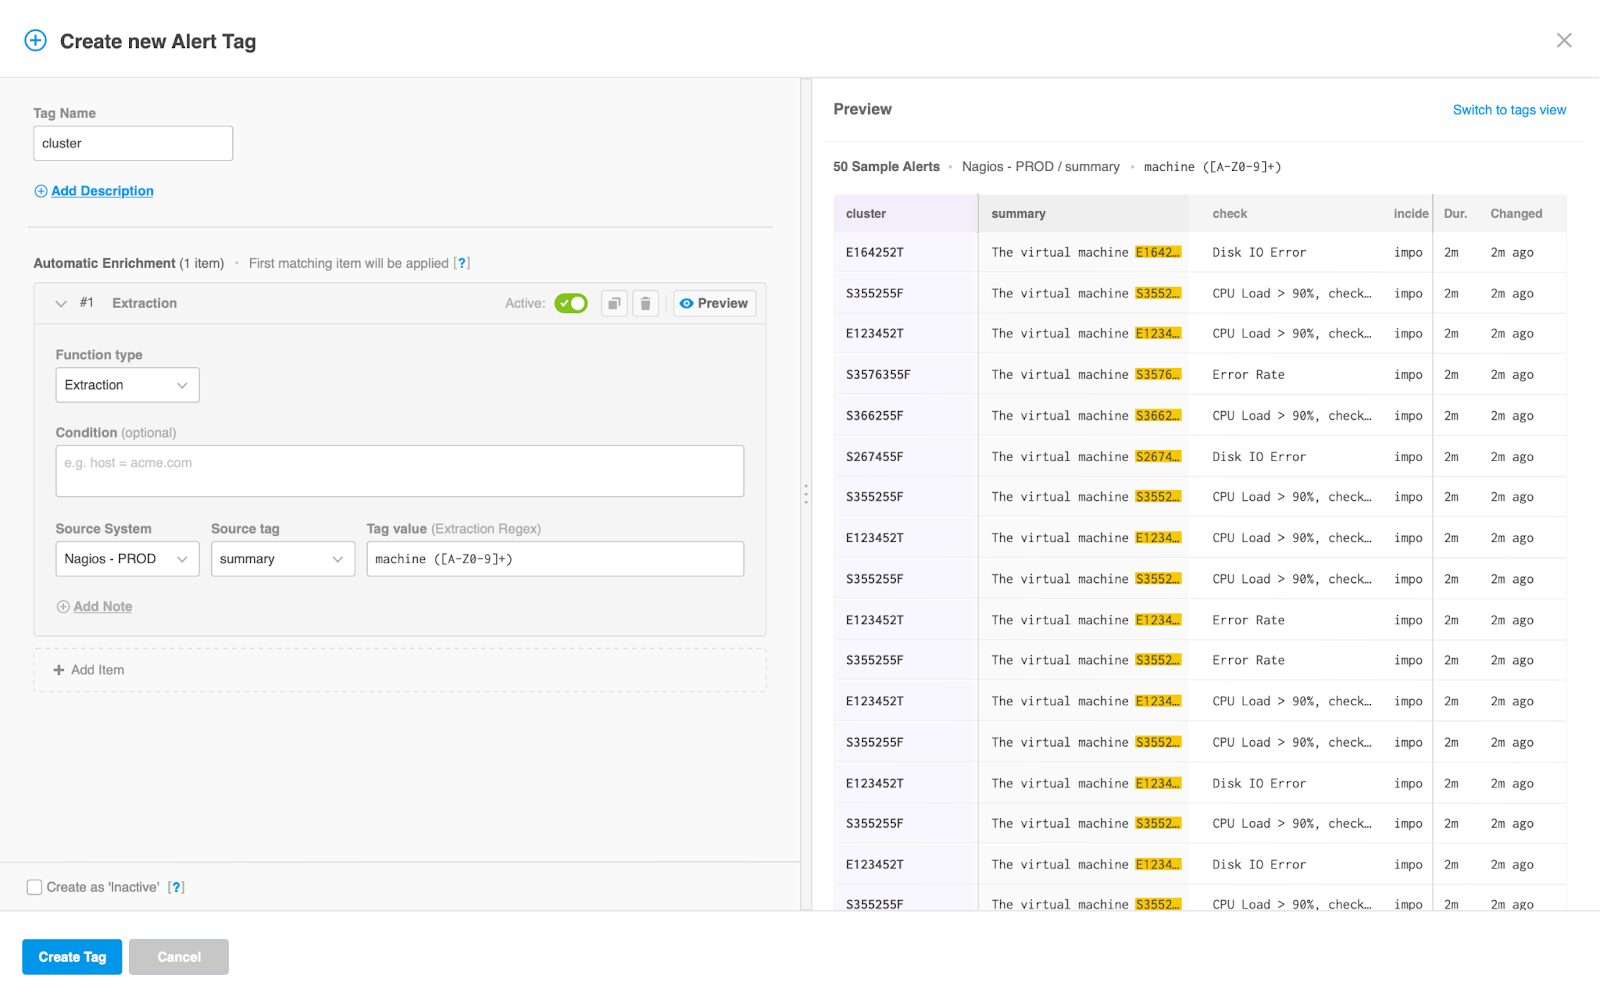
Event enrichment
BigPanda event enrichment adds additional contextual information to your alerts, including business segments, relevant CI/CD elements, or operational data. Once BigPanda ingests raw event data from integrated monitoring systems, it then normalizes them into key-value pairs called tags. Based on these existing tags, you can create new alert enrichment tags that add metadata to incoming events in your organization’s system.
Event enrichment enables you to accurately and quickly detect, understand, and resolve incidents. The enrichment of events also enables powerful event correlation so that you can detect and effectively respond to issues.
Things to consider for event enrichment:
- Tag execution order, by default, runs in the order of their creation.
- For tag dependencies, you need to ensure that a specific tag or map runs before another one because the tags and maps depend on each other.
- For an alert enrichment tag that has multiple enrichment rules, BigPanda uses the first matching rule in the enrichment tag. After finding the first match, the system does not run the remaining rules and moves to the following tag.
- BigPanda recommends a few high-impact tags to help make sure operators find the information in the system, while too many tags mean they have to dig through excess or duplicate information.
Once an enrichment logic is configured, always use the preview pane to check the results of that enrichment logic rapidly. The preview will show how the current enrichment logic would apply to these tags.
Event filtering
Alert filtering helps you stop duplicate, low-relevancy events from being correlated into incidents. Stopping alert noise before it reaches the incident feed allows you to focus on the most significant incidents and spend time and effort on the most critical issues.
Alert filtering affects alerts after they have been normalized and enriched. The added context of the enrichment process allows you to filter events based on alert metadata and enrichment tags.
Dynamic tagging allows you to automatically sort events with certain properties into special folders or mute them using snooze. Operators can achieve this using alert filtering or planned maintenance.
Things to remember for alert filtering:
- Alert filtering affects alerts after they have been normalized and enriched. The added context of the enrichment process allows you to filter events based on alert metadata and enrichment tags.
- Alert filters are not time-sensitive, but an optional time window can be added if required.
Planned maintenance
A maintenance plan dictates which alerts will be silenced during scheduled system maintenance. An alert that contains select conditions and occurs within the maintenance time window will be marked for maintenance.
BigPanda gives users the ability to filter out or suppress events generated for nodes or CIs that are under maintenance, in non-production environments, or that match other special circumstances where operators don’t need to be notified of potential outages or incidents.
Things to remember for planned maintenance:
- Alerts marked for maintenance can still be correlated to an incident if they match the incident’s criteria.
- An incident’s Status and Last Changed timestamps are determined by the presence of active alerts in the incident.
Users can also filter events using the event-filtering section of the Open Integration Manager. The Event Filtering section uses the same BigPanda Query Language as the rest of the BigPanda platform. Any events that meet the defined criteria will be dropped upon ingestion and never visible in the Incident feed.
Things to remember for the event filtering section:
- This section should only be used as a garbage filter for events that can never be actionable and would only add clutter in BigPanda. Below are some examples:
- Misconfiguration (certain tags that are critical for assignment and prioritization are missing)
- Lowest severity (we already know that it won’t be actionable and contains no signal)
- Events from Dev/QA environments
- Non-alerts (info, logs, etc.)
- Keep in mind that the syntax used here is based on the tags included in the event payload (Source Tags, not Destination Tags).
- If two different types of events from your monitoring tool use different tag names, be sure to include both in your filter criteria.
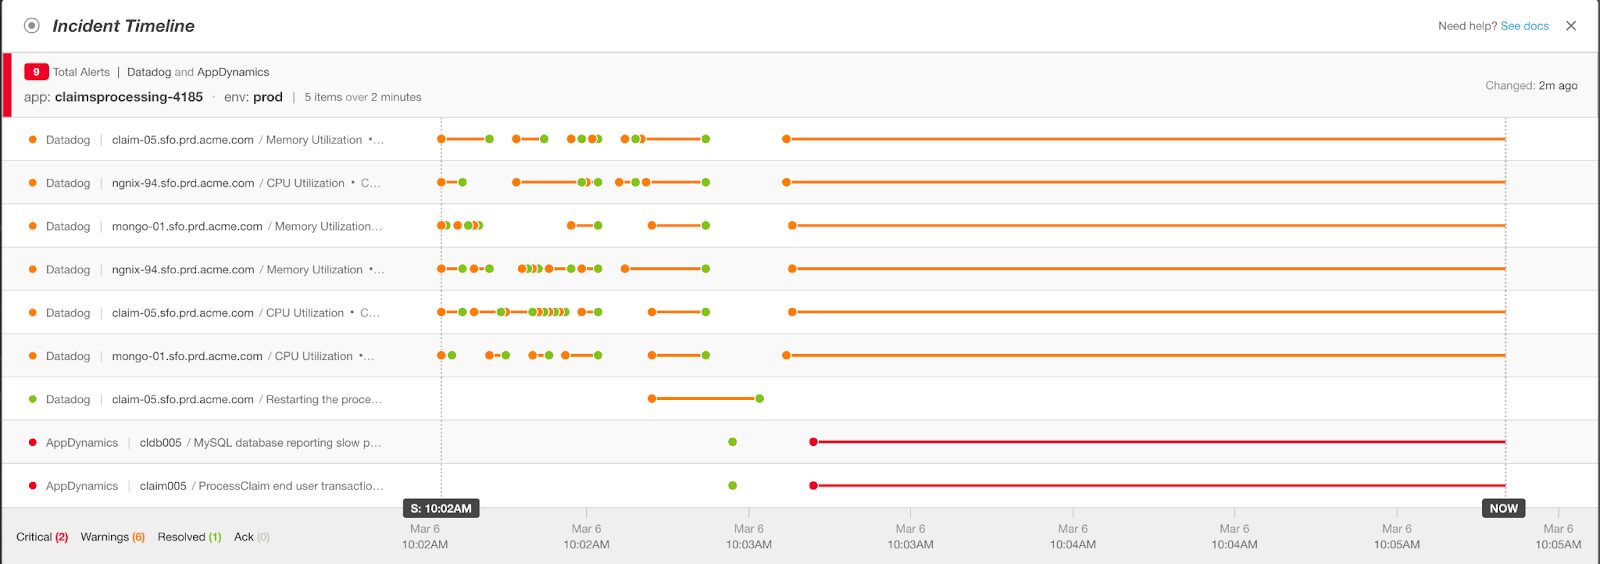
Event aggregation
Many times monitored resources change state, and a new event is generated corresponding to that state change (sometimes called a flapping event). BigPanda combines these similar events into a single alert that can be viewed in an easy-to-understand timeline view.
Rather than scrolling through tens or hundreds of alerts, the timeline view enables ITOps teams to visualize and focus on the full lifecycle of an alert. ITOps teams can see the current/latest status of the monitored resource in the context of the evolution of that alert over time.
Each event represents a single-state change for a specific sensor or measurement. As an outage or incident progresses, this status may change, resulting in new event notifications being triggered. Each row in the timeline represents an individual alert, with each dot representing an event in the life cycle of that alert. By carefully analyzing the evolution of an incident, major outages can be detected early.
Best practices for event aggregation:
- To quickly trace down the probable root cause of an incident, one of the ways to pinpoint an issue is to refer to the earliest events that were fired in the timeline.
- Event aggregation helps identify repetitive or ongoing errors during trend analysis. This trend analysis is extremely useful to drive continuous optimizations.
Alert correlation
Alert correlation is the process of grouping related alerts into meaningful, actionable incidents. BigPanda uses pattern recognition to automatically process the data generated by your monitoring systems, dynamically clustering alerts based on the rich context available from the alert enrichment process.
By default, during onboarding with BigPanda, several basic correlation patterns are configured for your organization. The default correlation patterns are ‘host’, ‘application’ (‘application’, ‘check’), and ‘service’. Depending upon the permission levels, users can edit, duplicate, temporarily deactivate, or permanently delete each alert correlation pattern.
We will be taking a closer look at alert correlation and how users can optimize correlation patterns according to their specific organization in an upcoming best practices guide.
Conclusion
To summarize, we’ve examined established best practices and things to consider and remember for getting started with BigPanda. By following this guide, BigPanda becomes the first pane of glass that ITOps teams can consult in order to quickly understand what is happening in their IT environments and know which action to take. Users are able to achieve noise reduction, eliminate silos, and increase the value provided by monitoring tools.
In our next best practices guide, we will cover best practices related to correlation, incident enrichment, probable root cause, and much more.
If you want to experience for yourself how BigPanda’s AIOps Incident Intelligence and Automation platform helps prevent and resolve IT outages, try our self-guided product tour today.