


A Practical Guide to Anomaly Detection for DevOps
The two categories of anomaly detection tools you should be aware of are log analysis and metric analysis tools. The first category aims to direct your attention to suspicious event patterns in the infinite ocean of data known as log files. The latter category identifies misbehaving time-series metrics, taking things such as time of day and shifting application behavior into account.
There are mature offerings in both categories, and even small operations teams can configure anomaly-based alerting with relative ease. Note, however, that at this point none of these offerings aim to fully replace traditional thresholds and rules.
Life Without Anomaly Detection
When comparing anomaly detection tools, the first option to consider is none at all. Indeed, your production environment has probably done well till now even without anomaly detection. So why should you invest your time in such a change now?
There are two parts to this answer:
- The first one relates to what you don’t know: there are things constantly happening in your environment that you’re not even aware of. You become involved only after they have real impact on performance, which, frankly, is too late. Anomaly detection bubbles up dangerous patterns proactively.
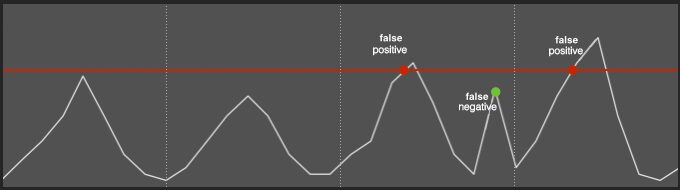
- The second relates to what you know too well: alert fatigue. Rule-based and threshold-based alerts tend to be noisy. Their static nature encourages 1) false positives during peak times and 2) false negatives during quieter times.
Before you look into an anomaly detection tool, you should ask yourself if you experience any of the above pains. If you’re content with your current state, perhaps implementing anomaly detection in your stack right now is premature. Otherwise, below are four tools you should consider.
Anomaly Detective by Prelert
Anomaly Detective by Prelert is a general-purpose anomaly detection engine, capable of consuming any stream of machine-data. Anomaly Detective detects significant changes to values or data rates, and can identify rare or unusual messages.
Prelert offers a solid REST API, which you can use to process virtually any data feed. Additionally, a slick dashboard allows exploring and visualizing anomalies. Of course, the vast majority of us are not going to implement a custom analytics solution using the API. And for that reason, Prelert also offers an out-of-the-box app for Splunk Enterprise, launched in early 2013.
Anomaly Detective for Splunk extends the Splunk search language with verbs tailored for anomaly detection. You start with a standard Splunk search query. Then you choose a timeframe for baseline evaluation. Anomaly Detective scans data from that timeframe in order to evaluate your system’s normal behavior. Finally, you filter search results to show only anomalies identified by Anomaly Detective. For example, you will be able to see unexpected log lines or unusually high event rates.
The Rundown:
- Product: Anomaly Detective for Splunk
- Pricing: $0-$225 / month (quote-based pricing for volumes above 10GB)
- Setup: On premise (OS X, Windows, Linux & SunOS versions available).
- Ease of Installation: Easy (assuming you already have Splunk Enterprise)
- Main Datatype: Log lines

Sumo Logic Anomaly Detection
Sumo Logic is a SaaS log aggregation platform. At first glance, Sumo Logic is similar to most cloud-based log aggregation tools, featuring data collection, search, and alerting. But Sumo Logic is differentiated with a useful log crunching capability called LogReduce. LogReduce consolidates thousands of log lines into just a few line items, by detecting recurring patterns.
In late 2013, Sumo Logic unveiled an anomaly detection solution built on top of LogReduce. Here’s how Sumo Logic explains the need for anomaly detection: thresholds are good at helping you react proactively to known issues, by triggering alerts before things go out of hand. Search allows you to investigate unknown issues, but only after they occur. Anomaly detection is the only way to react to unknown issues proactively.
Sumo Logic scans your historical data to evaluate a baseline representing normal data rates. Then it focuses on just the last few minutes, and looks for log patterns whose rates are below or above their baseline. For example, if one of your applications is throwing more exceptions than expected, Sumo Logic will trigger an alert. Thanks to LogReduce, anomaly detection will work even if the log lines are not exactly identical (e.g. some json parameters change between exceptions).
Another nice feature of Sumo Logic’s anomaly detection is the ability to name and annotate anomalies. Once you annotate an anomaly, Sumo Logic will present your annotations whenever the anomaly occurs. This essentially allows you to turn unknown issues into known ones.
Take a look at this excellent webinar (55 minutes) for an in-depth overview of Sumo Logic’s anomaly detection.
The Rundown:
- Product: Sumo Logic
- Pricing: Quote-based
- Setup: SaaS (+ on-premise data collectors)
- Ease of Installation: Average (you’ll need to deploy Sumo Logic’s full solution)
- Main Datatype: Log lines

Grok by Numenta
Co-founded by Jeff Hawkins (author of the excellent book, On Intelligence), Numenta is a developer of bleeding-edge data-analysis solutions. In 2007, Numenta released NuPIC, a data prediction and anomaly detection library, leveraging algorithms modeled after human memory (now available as an open-source project). This year, Numenta released their first commercial offering, Grok for IT Analytics, an anomaly detection solution for AWS.
Grok works with most of Amazon’s web services, including EC2, EBS, ELB, RDS, and others. It also has an API for custom metrics, so it’s fairly easy to process data generated by statsd (or other standard collectors). Grok analyzes your system metrics, and warns you in realtime when the metrics are behaving abnormally.
Curiously, Grok relies on an Android mobile app as their main UI. The UI uses bar charts to visualize anomaly levels for each of your metrics. Higher values in the charts represent anomalous behavior you should probably investigate. If you want to be alerted when something is particularly anomalous, you can set up email & mobile notifications. Installing Grok requires launching a dedicated Grok instance in your cloud environment. The more metrics you’d like to measure, the stronger the instance will have to be. Finally, Grok comes with an easy-to-handle configuration UI.
The Rundown:
- Product: Grok
- Pricing: $219/month for 200 monitored instances or custom metrics (free tier available)
- Setup: Dedicated AWS instance
- Ease of Installation: Easy (just deploy a Grok instance, and use the UI to configure)
- Main Datatype: System Metrics

Skyline by Etsy
Between StatsD, Kale and nagios-herald, Etsy has long established itself as the most prolific open-source contributor to the monitoring space. Skyline, part of the Kale two-product stack, is Etsy’s anomaly detection solution for Ops-related metrics. According to Etsy, the reasoning behind building an anomaly detection solution is that they are measuring too many things to track manually. Etsy needed a way to automatically bubble up metrics that were misbehaving, and Skyline was their answer.
Skyline has several components. A python-based daemon called Horizon accepts time-series data via TCP and UDP inputs. You can also stream your graphite metrics into Horizon with a couple of tweaks to the graphite config. Horizon uploads the data to a redis instance, where it is processed by another python daemon called Analyzer. Analyzer utilizes an ensemble of statistical algorithms to decide what time series are behaving abnormally. A minimalist web UI lists all the active anomalies and visualizes their underlying graphs.
In addition to detecting anomalies, Etsy also addresses the issue of anomaly investigation. Oculus is the other half of the Kale stack. It’s fundamentally a search engine for graphs, where you input one graph, and locate other graphs that behave like it. When you detect an anomaly using Skyline, use Oculus to search for graphs that are suspiciously correlated to the offending graph. Oculus is not as easy to set up as Skyline, so I suggest you start by trying out Skyline for a few days before getting Oculus.
The Rundown:
- Product: Skyline
- Pricing: Open-source
- Setup: On-premise
- Ease of Installation: Average (you’ll need a few python packages, redis and probably graphite)
- Main Datatype: System Metrics

In Summary
Recent years have seen an explosion in the volumes of data that modern production environments generate. Making fast educated decisions about production incidents is more challenging than ever. BigPanda’s team is passionate about solutions such as anomaly detection that tackle this very challenge.
The reason we founded BigPanda in the first place was to provide an incident management solution designed specifically to help Ops teams handle the scale and complexity of modern production environments. Come and take a look at what we’re building…take a tour.