-
Platform
-
-
Agentic ITOps PlatformThe BigPanda agentic ITOps platform is the next step in AIOps platforms. Using AI to automate IT from detection to resolution, improving operational efficiency.Explore the Platform
-
-
-
Solutions
-
-
Transform ITSM with Agentic ITOpsLearn how enterprises can empower incident management teams with AI assistance by integrating agentic AI into their incident management strategy.Get the e-book
-
-
- Customers
-
Resources
-
-
Derisking IT Change Management with Agentic AIDiscover why change risk management is no longer human-scale & which AI & automation features can prevent change-related incidents.Read the White Paper
-
-
- Resource Type
-
AIOps Blog
-
Case Studies
-
E-books
-
Webinars & Events
-
All Resources
-
- Customer Resources
-
Customer Support
-
Professional Services
-
BigPanda Education
-
-
Company
-
-
CareersWe’re looking for talented, passionate, creative, and fun people to join our embarrassment of Pandas. (Yes, that’s really what a group of pandas is called!)Learn More
-
-
- Media and Recognition
-
Awards
-
Analysts Reports
-
Newsroom
-
- Service + Support
- Login
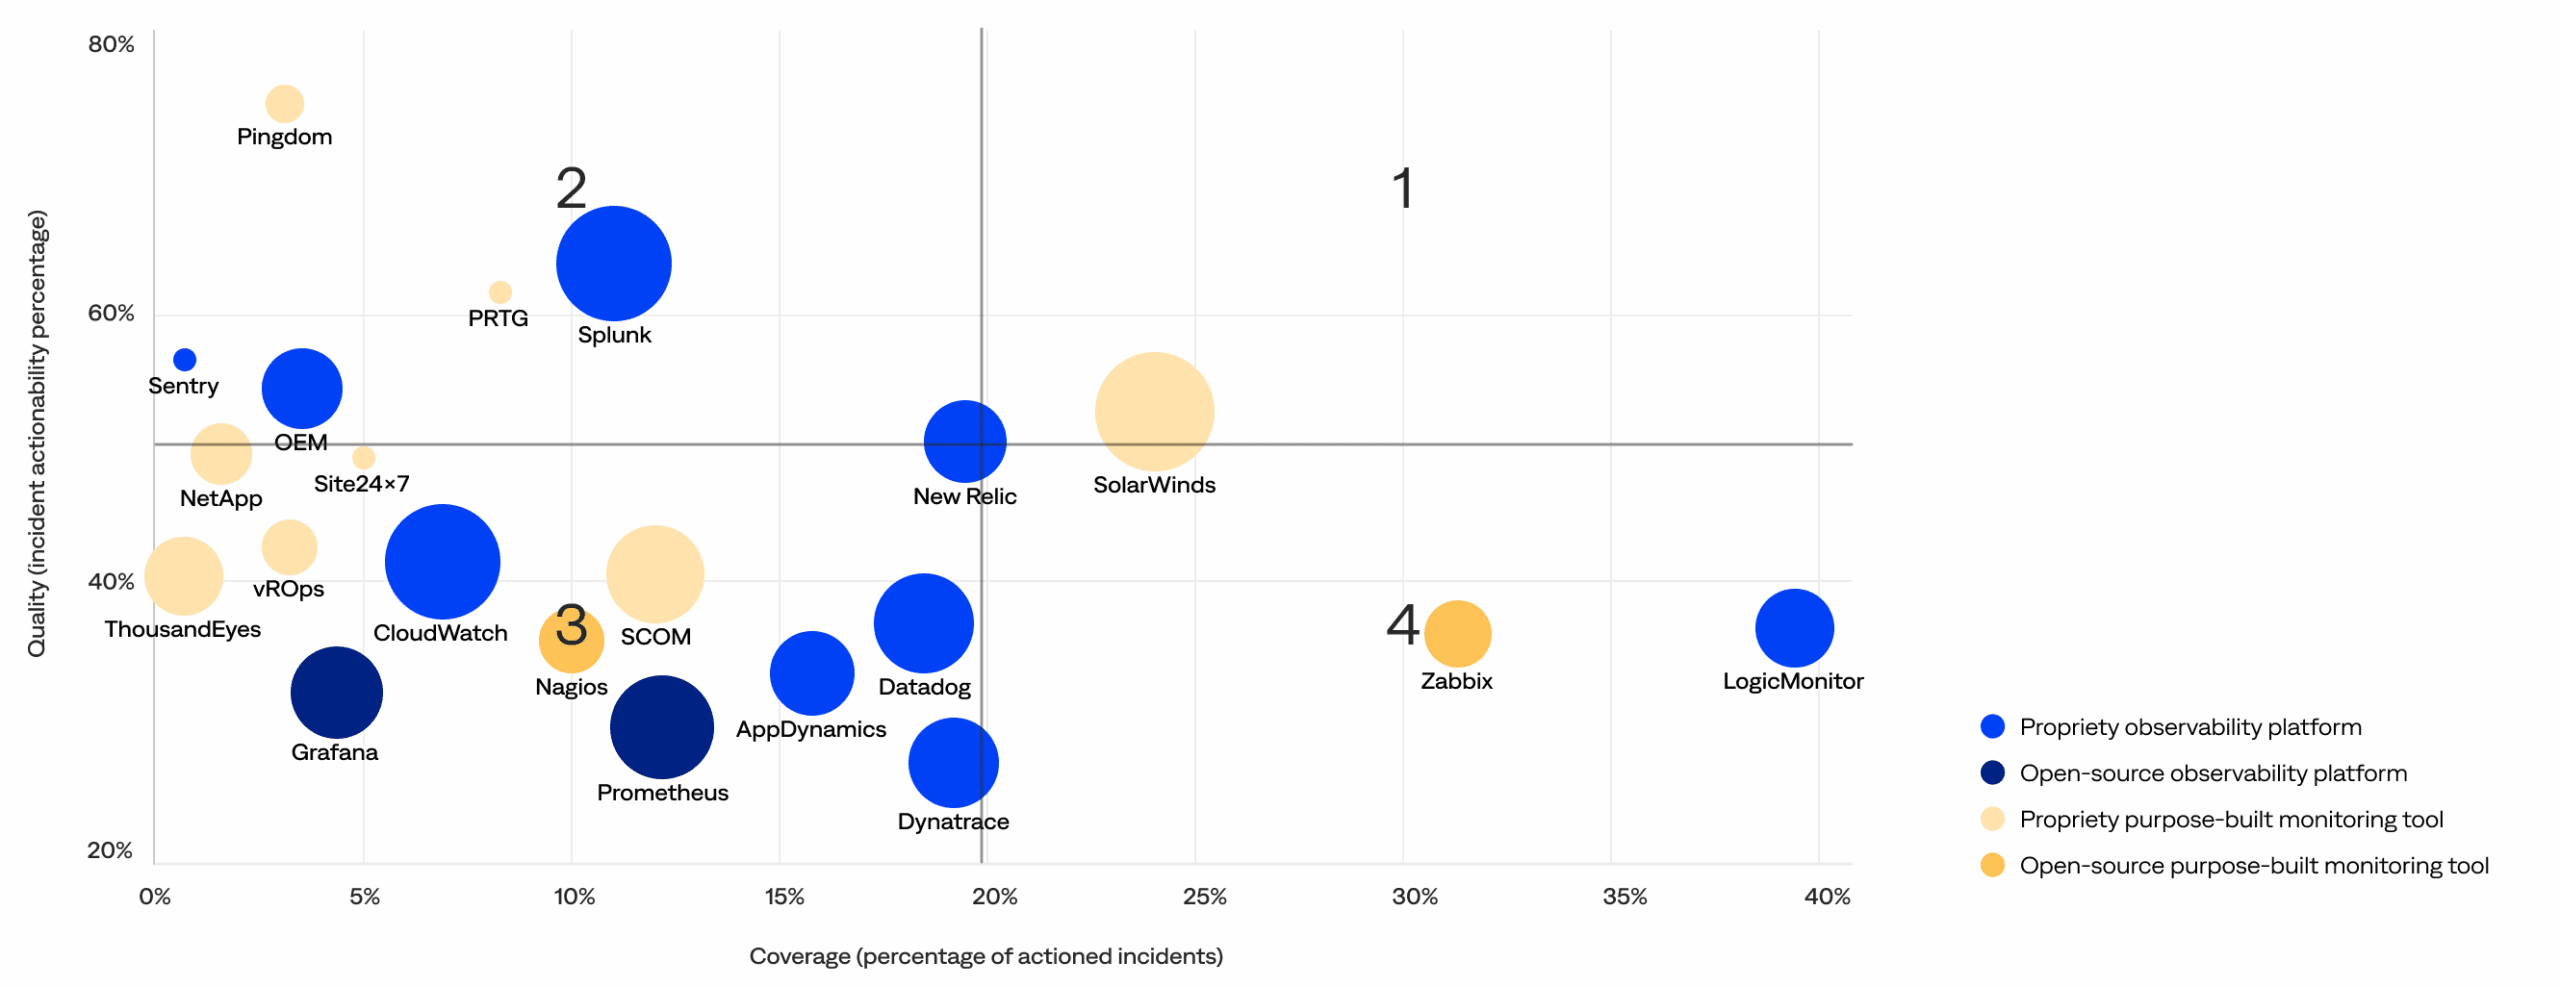
Monitoring and observability tool effectiveness matrix
This section compares the quality (actionability rate) and coverage (percentage of actioned incidents) of the incidents generated by each monitoring and observability vendor or solution to identify high-quality tools and noisy tools that need improvement. It includes a matrix with four quadrants:
2. High-quality, low-coverage: These optimized, high-performance tools in the upper-left quadrant generate fewer incidents but maintain a high rate of actionable incidents. Ideal for targeted use cases, they deliver substantial value when deployed and may be candidates for broader adoption.
1. High-quality, high-coverage: These signal-rich, low-noise tools in the upper-right quadrant are widely deployed and consistently deliver actionable incidents. They balance signal volume and strength, making them key assets in effective observability strategies.
3. Low-quality, low-coverage: These underutilized tools in the bottom-left quadrant are less prevalent and show lower signal quality, demonstrating opportunities to evolve through better integration, improved configuration, or rationalization. They may be in early adoption phases or used for narrower scopes.<
4. Low-quality, high-coverage: These scalable but noisy tools in the bottom-right quadrant contribute significantly to incident volume with fewer actionable insights. While widely used, they may benefit from tuning or configuration improvements to reduce noise and increase operational value.

Monitoring and observability tool effectiveness matrix (bubble size increases with customer usage)
- PlatformPlatform
- Agentic IT Operations
- Platform Overview
- AI Detection & Response
- AI Incident Assistant
- AI Incident Prevention
- IT Knowledge Graph
- BigPanda AIOps
- BigPanda Core
- Advanced Insight
- Biggy AI
- Rebranding Matrix
- Integrations
- Security & Compliance
- Features
- Detection
- Open Integration Hub
- AI Detection
- Diagnosis
- Service Desk Correlation
- Suggested Actions
- Incident Correlation
- Triage
- Automated Incident Triage
- Root Cause Analysis
- Similar Incidents
- Prevention
- Change Risk Management
- Problem Management
- Solutions
- Automating L1 Detection & Response
- Empowering Experts with AI Assistance
- Predicting & Preventing Disruptions
- Personas
- IT operations
- Incident management
- IT service management
- Site Reliability Engineering
- Industries
- Financial services
- Manufacturing
- Insurance
- Media and entertainment
- Managed services
- All industries
- Services + Support
- Platform status
- Community
- Customer support
- Documentation
- Professional services


