Monitoring and observability tool integrations
The first step in incident detection is configuring inbound monitoring and observability integrations with BigPanda to receive events. BigPanda includes about 50 standard integrations with popular tools, and customers can also create custom integrations. This data feeds into the BigPanda IT Knowledge Graph.
This section reviews the number and types of inbound integrations, how many were open-source or proprietary, which monitoring and observability tool vendors and solutions were used the most and generated the most events, their effectiveness, and the top four monitoring and observability tool trends.
Key monitoring and observability tool integration highlights:
of all known inbound observability platform integrations were with Amazon CloudWatch
View Observability Integrations ↓of all known inbound purpose-built monitoring integrations were with SolarWinds
View Monitoring Integrations ↓“Observability is a journey. BigPanda AIOps is a key part of this journey for us. As we scale and grow the business, it’s integral for us to bring in automation and integration with other tools and technologies. Don’t wait to start your AIOps journey once you are overwhelmed with alerts. Start early to get a single pane of glass to understand which monitoring tools you really need.”
–Vice President of Information Technology, Manufacturing Enterprise
Number of inbound integrations
The number of inbound integrations per organization ranged from one to 198, with a median of 20.
- Most (79%) organizations had 10 or more inbound integrations, including 36% with 25 or more, and 19% with 50 or more.
- Nearly half (42%) had between 10 and 24 inbound integrations.
- Just 22% had fewer than 10 inbound integrations.
of organizations had 10+ inbound integrations
Number of inbound integrations with BigPanda
Types of inbound integrations
This section reviews the known inbound integrations by category and license type.
Categories
Each known inbound integration vendor or solution was grouped into one of three categories:
- Observability platforms—such as Amazon CloudWatch, Datadog, Dynatrace, Prometheus, and Splunk—offer multiple monitoring types in a unified view. Most (92%) organizations had at least one inbound integration with an observability platform. Nearly two-thirds (61%) of the known inbound integrations were between BigPanda and 20 observability platforms. However, only 19% of the known inbound integration vendors or solutions fell into this category. Nearly a quarter (22%) of the events were from observability platforms.
- Purpose-built monitoring tools—such as Cisco ThousandEyes, Microsoft System Center Operations Manager (SCOM), Site24x7, SolarWinds, and Zabbix—offer one or two more focused, specialized types of monitoring. Over three-quarters (82%) of organizations had at least one inbound integration with a purpose-built monitoring tool. A third (33%) of the known inbound integrations were between BigPanda and 72 purpose-built monitoring tools. Over two-thirds (69%) of the inbound integration vendors or solutions fell into this category. Half (50%) of the events were from purpose-built monitoring tools.
- Non-monitoring platforms, systems, or tools—such as Cribl, Databricks, MongoDB, Moogsoft, and ServiceNow—bring in non-monitoring-related data. Over a quarter (29%) of organizations had at least one inbound integration with a non-monitoring tool. Just 6% of inbound integrations were between BigPanda and 12 non-monitoring tools. Only 11% of the inbound integration vendors or solutions fell into this category. More than a quarter (27%) of the events were from non-monitoring platforms, systems, or tools.
of the known inbound integrations were with observability platforms
Percentage of inbound integrations
Percentage of inbound integrations by inbound integration category
Percentage of vendors or solutions
Percentage of vendors or solutions by inbound integration category
Percentage of organizations
Percentage of organizations by inbound integration category
Percentage of events
Percentage of events by inbound integration category
View the most integrated vendors and solutions, as well as the effectiveness of each monitoring and observability vendor or solution.
License types
Nearly three-quarters (73%) of the known integrations were with proprietary vendors, such as Cisco AppDynamics, Datadog, LogicMonitor, New Relic, and VMware vRealize Operations (vROps).
The remaining 27% were with open-source solutions, such as the ELK Stack (Elasticsearch, Logstash, and Kibana), Grafana, Jenkins, Prometheus, and Sensu.
of the known inbound integrations were with open-source solutions
Percentage of inbound integrations with BigPanda that were proprietary or open-source
The following table compares the percentage of proprietary versus open-source inbound integrations by vendor or solution type.
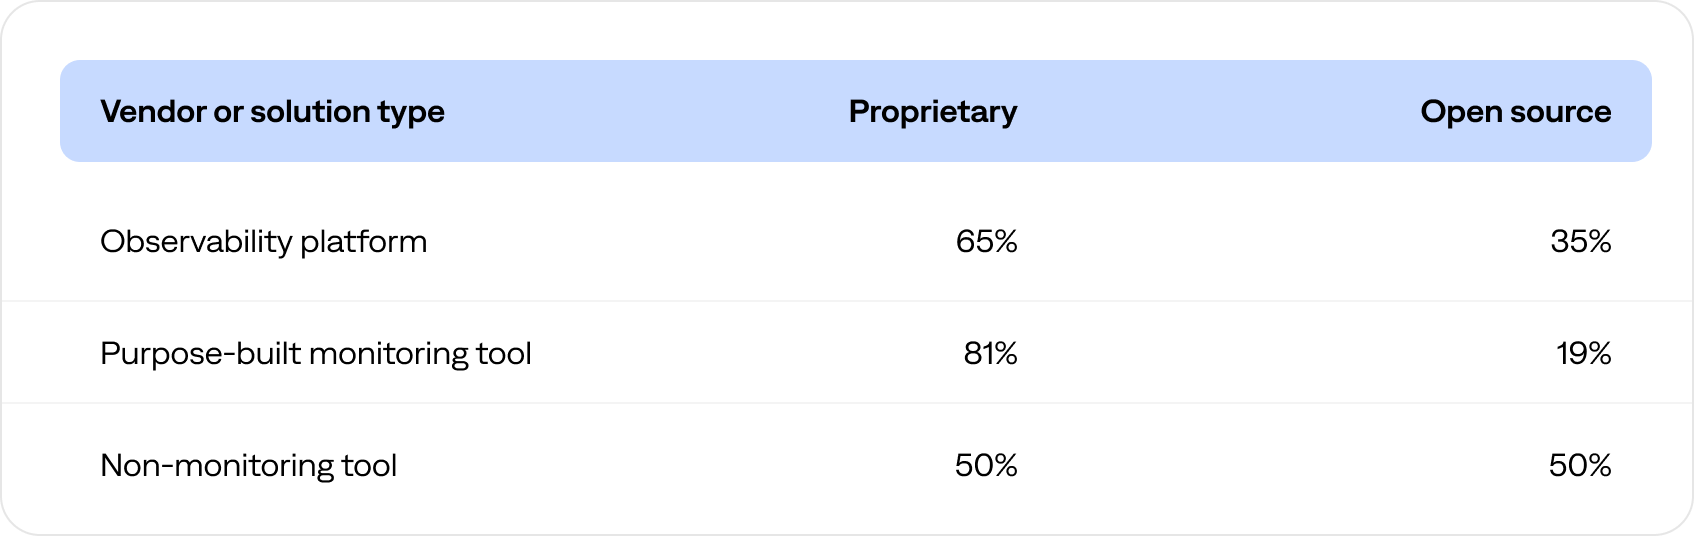
Integrations and events by vendor and solution
Altogether, 104 known vendors and solutions had inbound integrations with the BigPanda platform.
- The vendor or solution that had the most integrations with BigPanda was Amazon CloudWatch (12%), followed by New Relic (11%) and Prometheus (9%).
- The vendor or solution that generated the most events in BigPanda was Cribl (13%), followed by CA Spectrum (10%) and CGI DigiOps (9%).
- The top 10 most-integrated vendors or solutions were all observability platforms or purpose-built monitoring tools, but three out of 10 of the top event generators were non-monitoring tools.
Therefore, the number of integrations didn’t necessarily correlate with the number of events generated per vendor or solution.
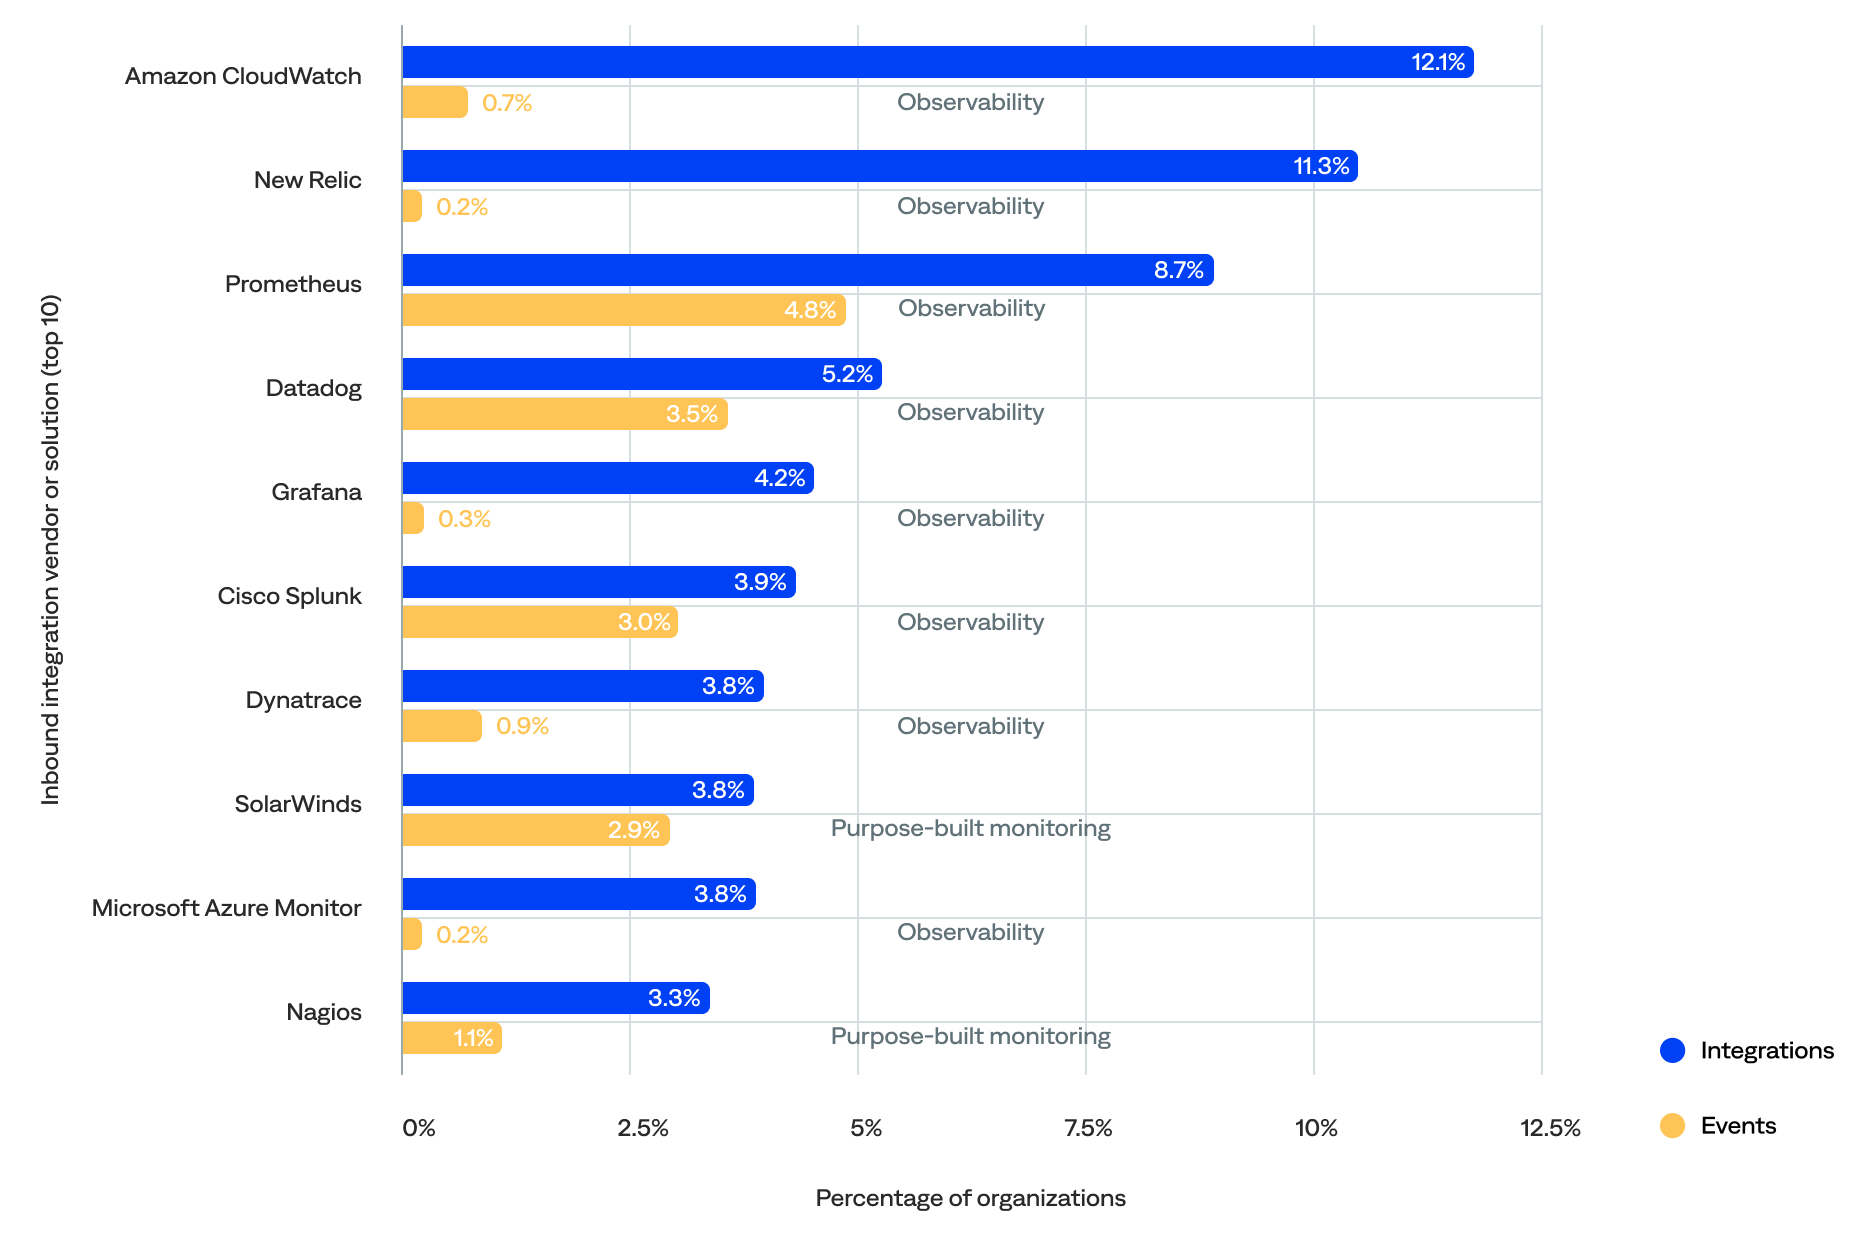
Percentage of integrations and events for each vendor or solution (top 10 by number of integrations)


Observability platform integrations and events
Nearly two-thirds (61%) of the known inbound integrations were between BigPanda and 20 observability platforms, which were responsible for 22% of the events.
- The top five most integrated observability platform vendors or solutions included Amazon CloudWatch (20%), New Relic (19%), Prometheus (14%), Datadog (9%), and Grafana (7%).
- The top five observability platform vendors or solutions that generated the most events were Prometheus (22%), LogicMonitor (20%), Datadog (16%), Cisco Splunk (14%), and Cisco AppDynamics (12%).
- Only two—Prometheus and Datadog—were in the top five for both the percentage of integrations and events.
- Nearly two-thirds (65%) of the integrated observability platform vendors or solutions were proprietary, and the remaining 35% were open source.
of all known inbound observability platform integrations were with Amazon CloudWatch
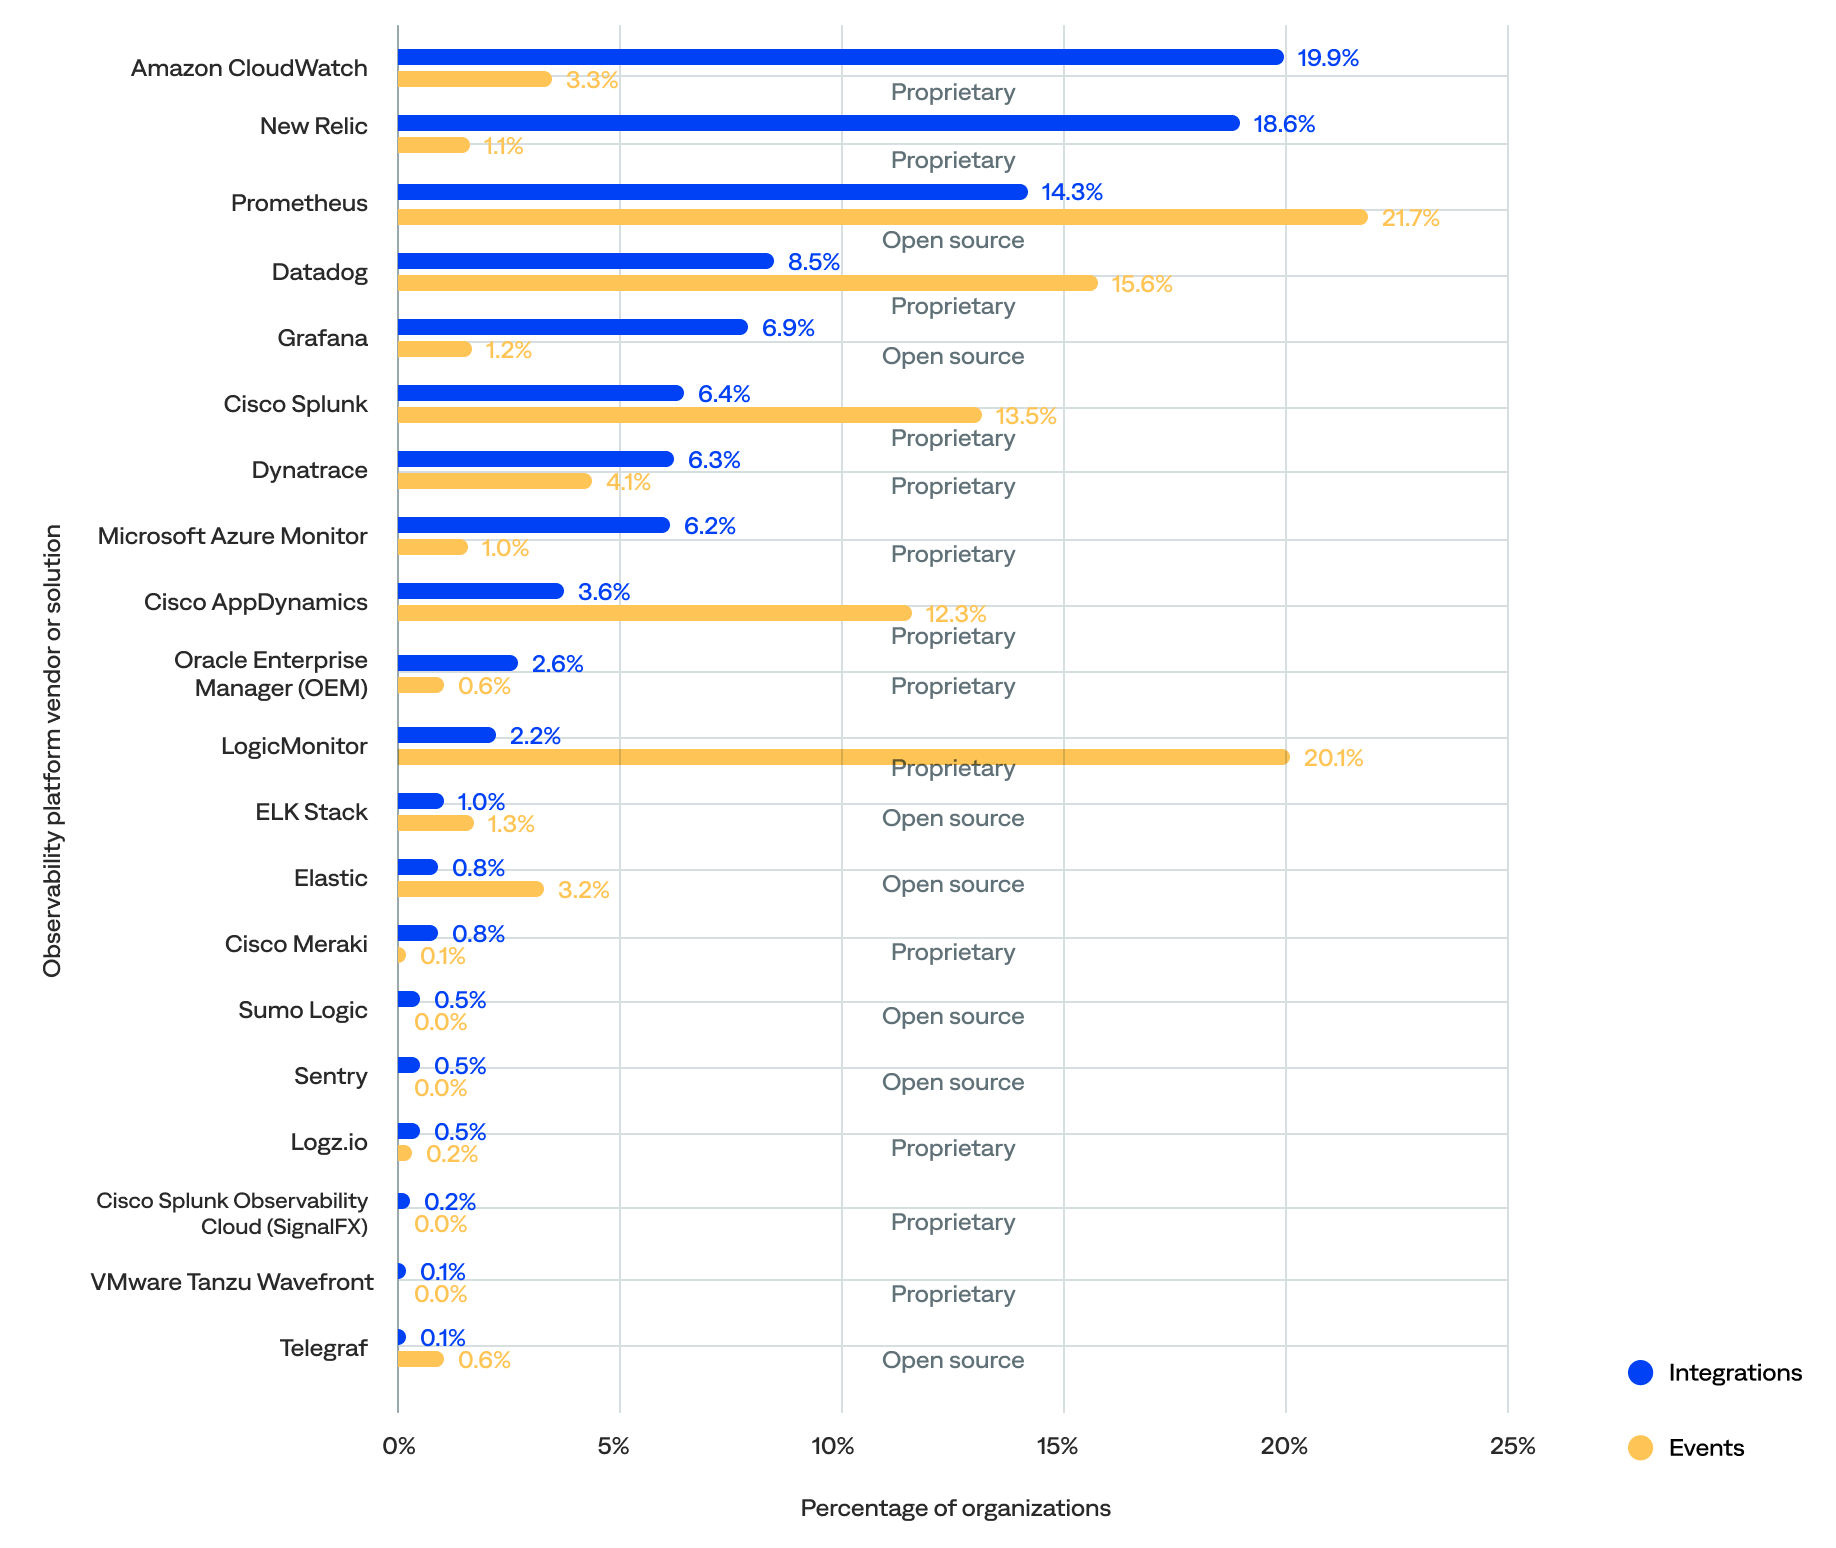
Percentage of integrations and events generated for each observability platform vendor or solution (by number of integrations)


Purpose-built monitoring tool integrations and events
A third (33%) of the known inbound integrations were between BigPanda and 72 purpose-built monitoring tools, which were responsible for 50% of the events.
- The top five most integrated purpose-built monitoring vendors or solutions included SolarWinds (12%), Nagios (10%), CGI DigiOps (9%), SCOM (8%), and VMware vRealize Operations (vROps) (6%).
- The top five purpose-built monitoring tool vendors or solutions that generated the most events were CA Spectrum (20%), Hydra (16%), Logstash (11%), SolarWinds (6%), and SCOM (3%).
- Only two—SolarWinds and SCOM—were in the top five for both the percentage of integrations and events.
- Over three-quarters (81%) were proprietary, and the remaining 19% were open source.
- The most commonly integrated purpose-built monitoring tools focused on IT infrastructure monitoring (31%), network performance monitoring (17%), managed infrastructure services (11%), DEM (7%), and backup and recovery software (5%).
of all known inbound purpose-built monitoring integrations were with SolarWinds
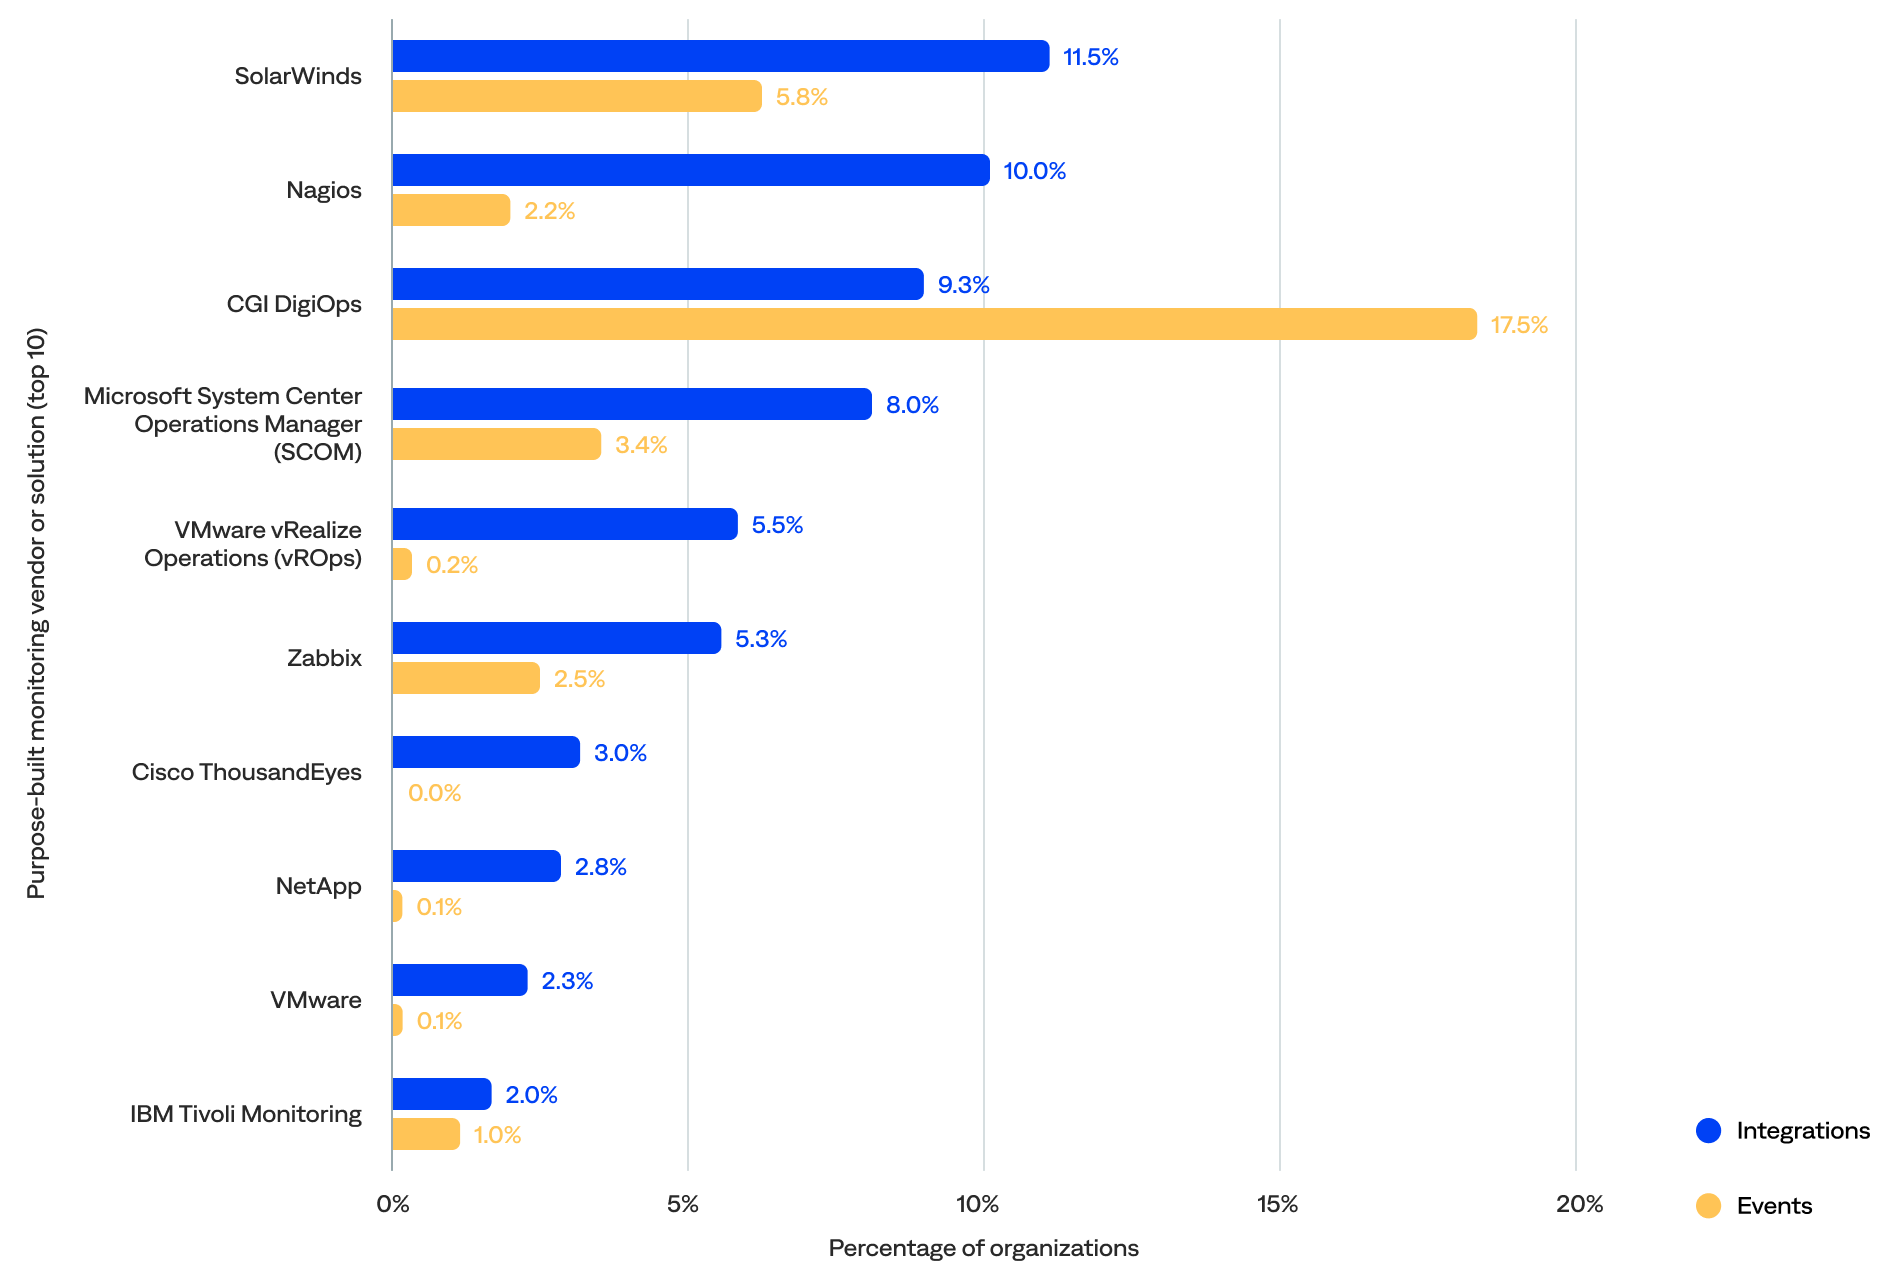


Percentage of integrations and events for each purpose-built monitoring tool vendor or solution (top 10 by number of integrations)
View the effectiveness of popular purpose-built monitoring tools.
Non-monitoring tool integrations and events
Just 6% of the known inbound integrations were between BigPanda and 12 non-monitoring tools, which were responsible for 27% of the events.
- The top five most integrated non-monitoring vendors or solutions included Cribl (26%), ServiceNow (14%), Sensu (13%), Apache Kafka (13%), and MongoDB (9%).
- The top five non-monitoring tool vendors or solutions that generated the most events were Cribl (48%), Sensu (28%), Apache Kafka (15%), Moogsoft (4%), and IBM Netcool (3%).
- Three—Cribl, Sensu, and Apache Kafka—were in the top five for both the percentage of integrations and events, and Cribl was the top for both.
- Half (50%) of the integrated non-monitoring vendors or solutions were proprietary, and the remaining 50% were open source.
- The most commonly integrated non-monitoring tools were from telemetry pipelines (40%), event brokers (15%), ITSM platforms (13%), database management systems (11%), event intelligence solutions (7%), and data integration tools (7%).
of all known inbound non-monitoring integrations were with Cribl
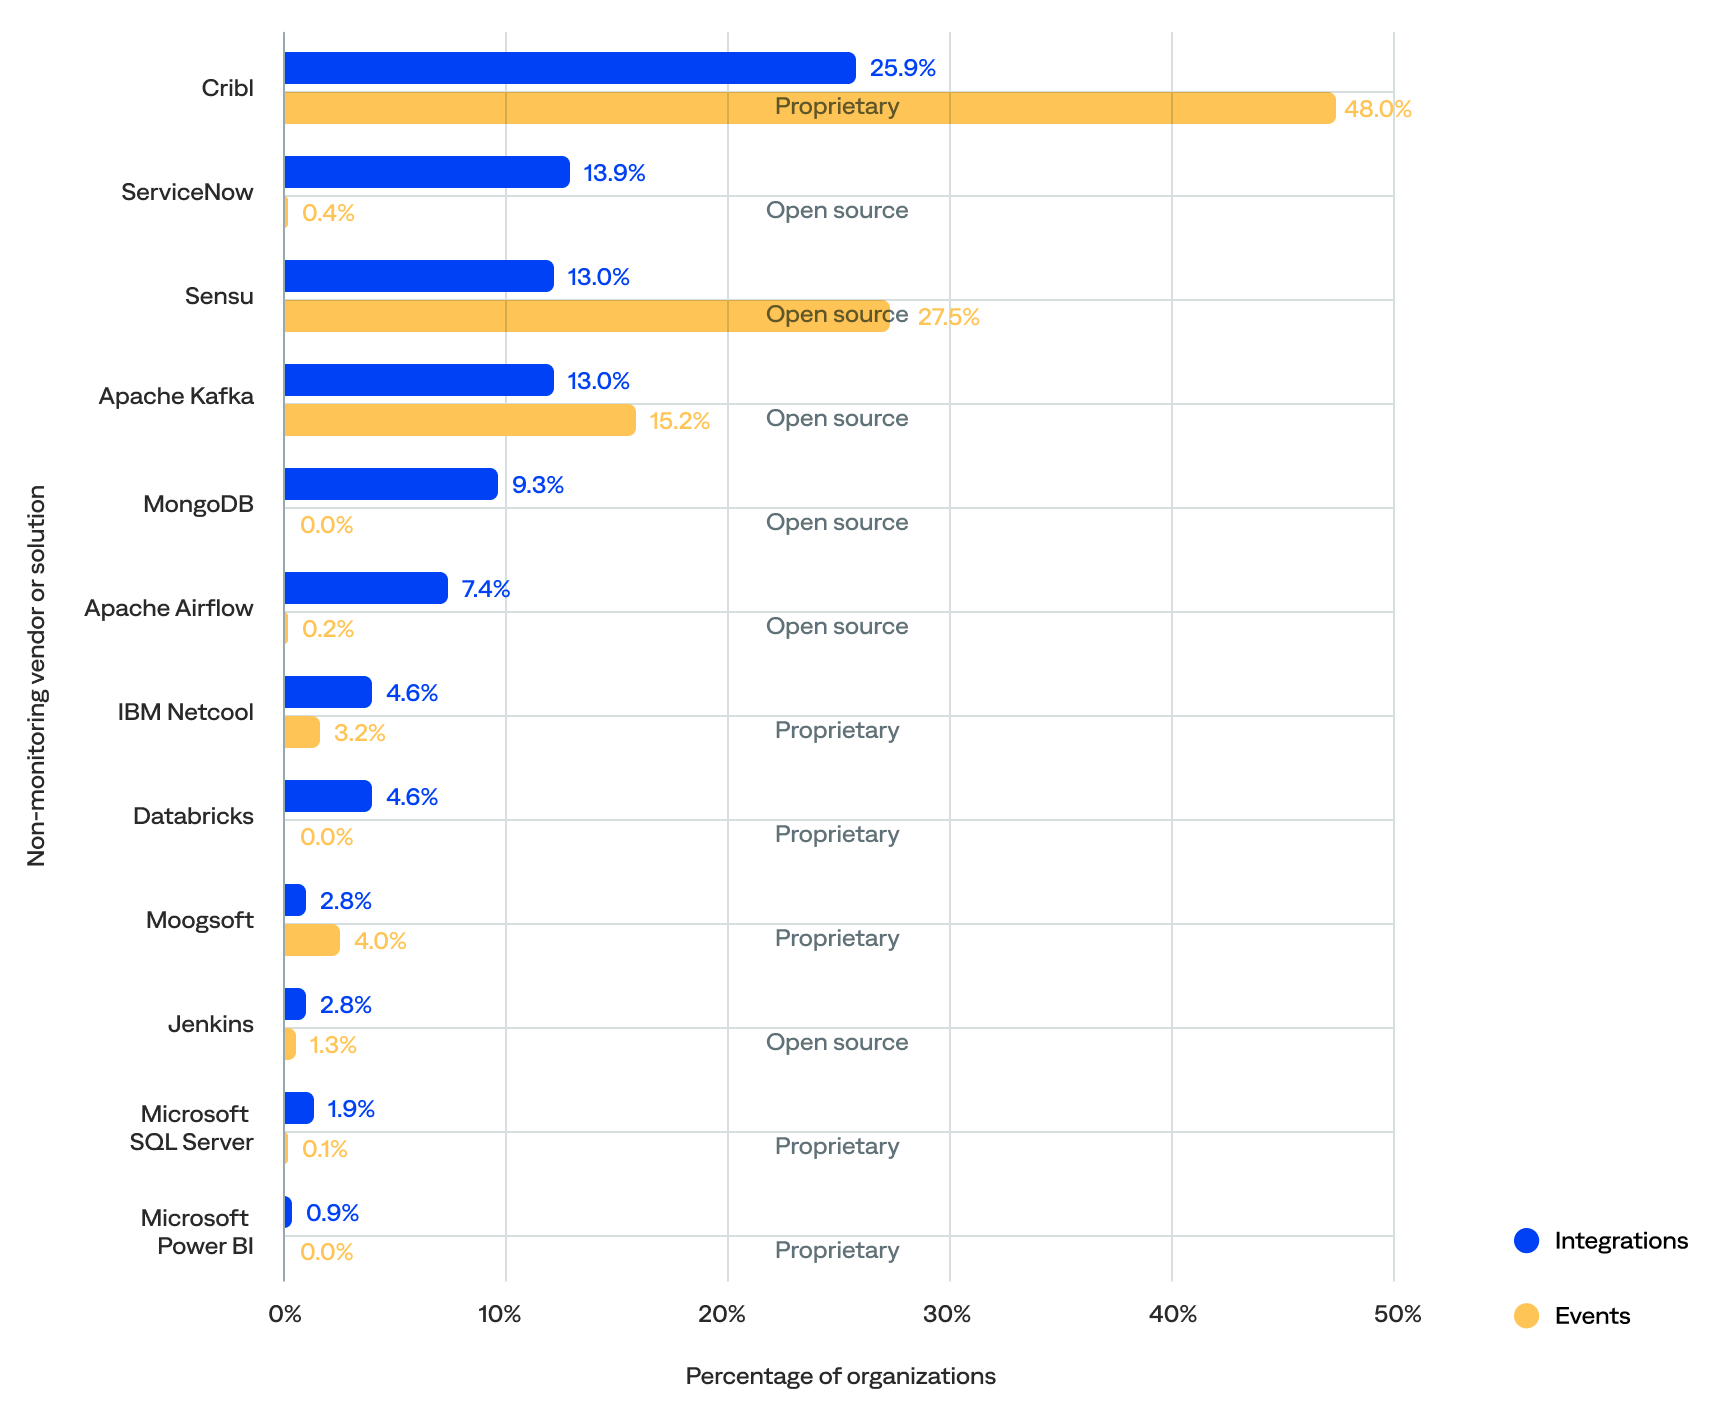


Percentage of integrations and events for each non-monitoring tool vendor or solution (by number of integrations)
Monitoring and observability tool effectiveness matrix
This section compares the quality (actionability rate) and coverage (percentage of actioned incidents) of the incidents generated by each monitoring and observability vendor or solution to identify high-quality tools and noisy tools that need improvement. It includes a matrix with four quadrants:
2. High-quality, low-coverage: These optimized, high-performance tools in the upper-left quadrant generate fewer incidents but maintain a high rate of actionable incidents. Ideal for targeted use cases, they deliver substantial value when deployed and may be candidates for broader adoption.
1. High-quality, high-coverage: These signal-rich, low-noise tools in the upper-right quadrant are widely deployed and consistently deliver actionable incidents. They balance signal volume and strength, making them key assets in effective observability strategies.
3. Low-quality, low-coverage: These underutilized tools in the bottom-left quadrant are less prevalent and show lower signal quality, demonstrating opportunities to evolve through better integration, improved configuration, or rationalization. They may be in early adoption phases or used for narrower scopes.<
4. Low-quality, high-coverage: These scalable but noisy tools in the bottom-right quadrant contribute significantly to incident volume with fewer actionable insights. While widely used, they may benefit from tuning or configuration improvements to reduce noise and increase operational value.
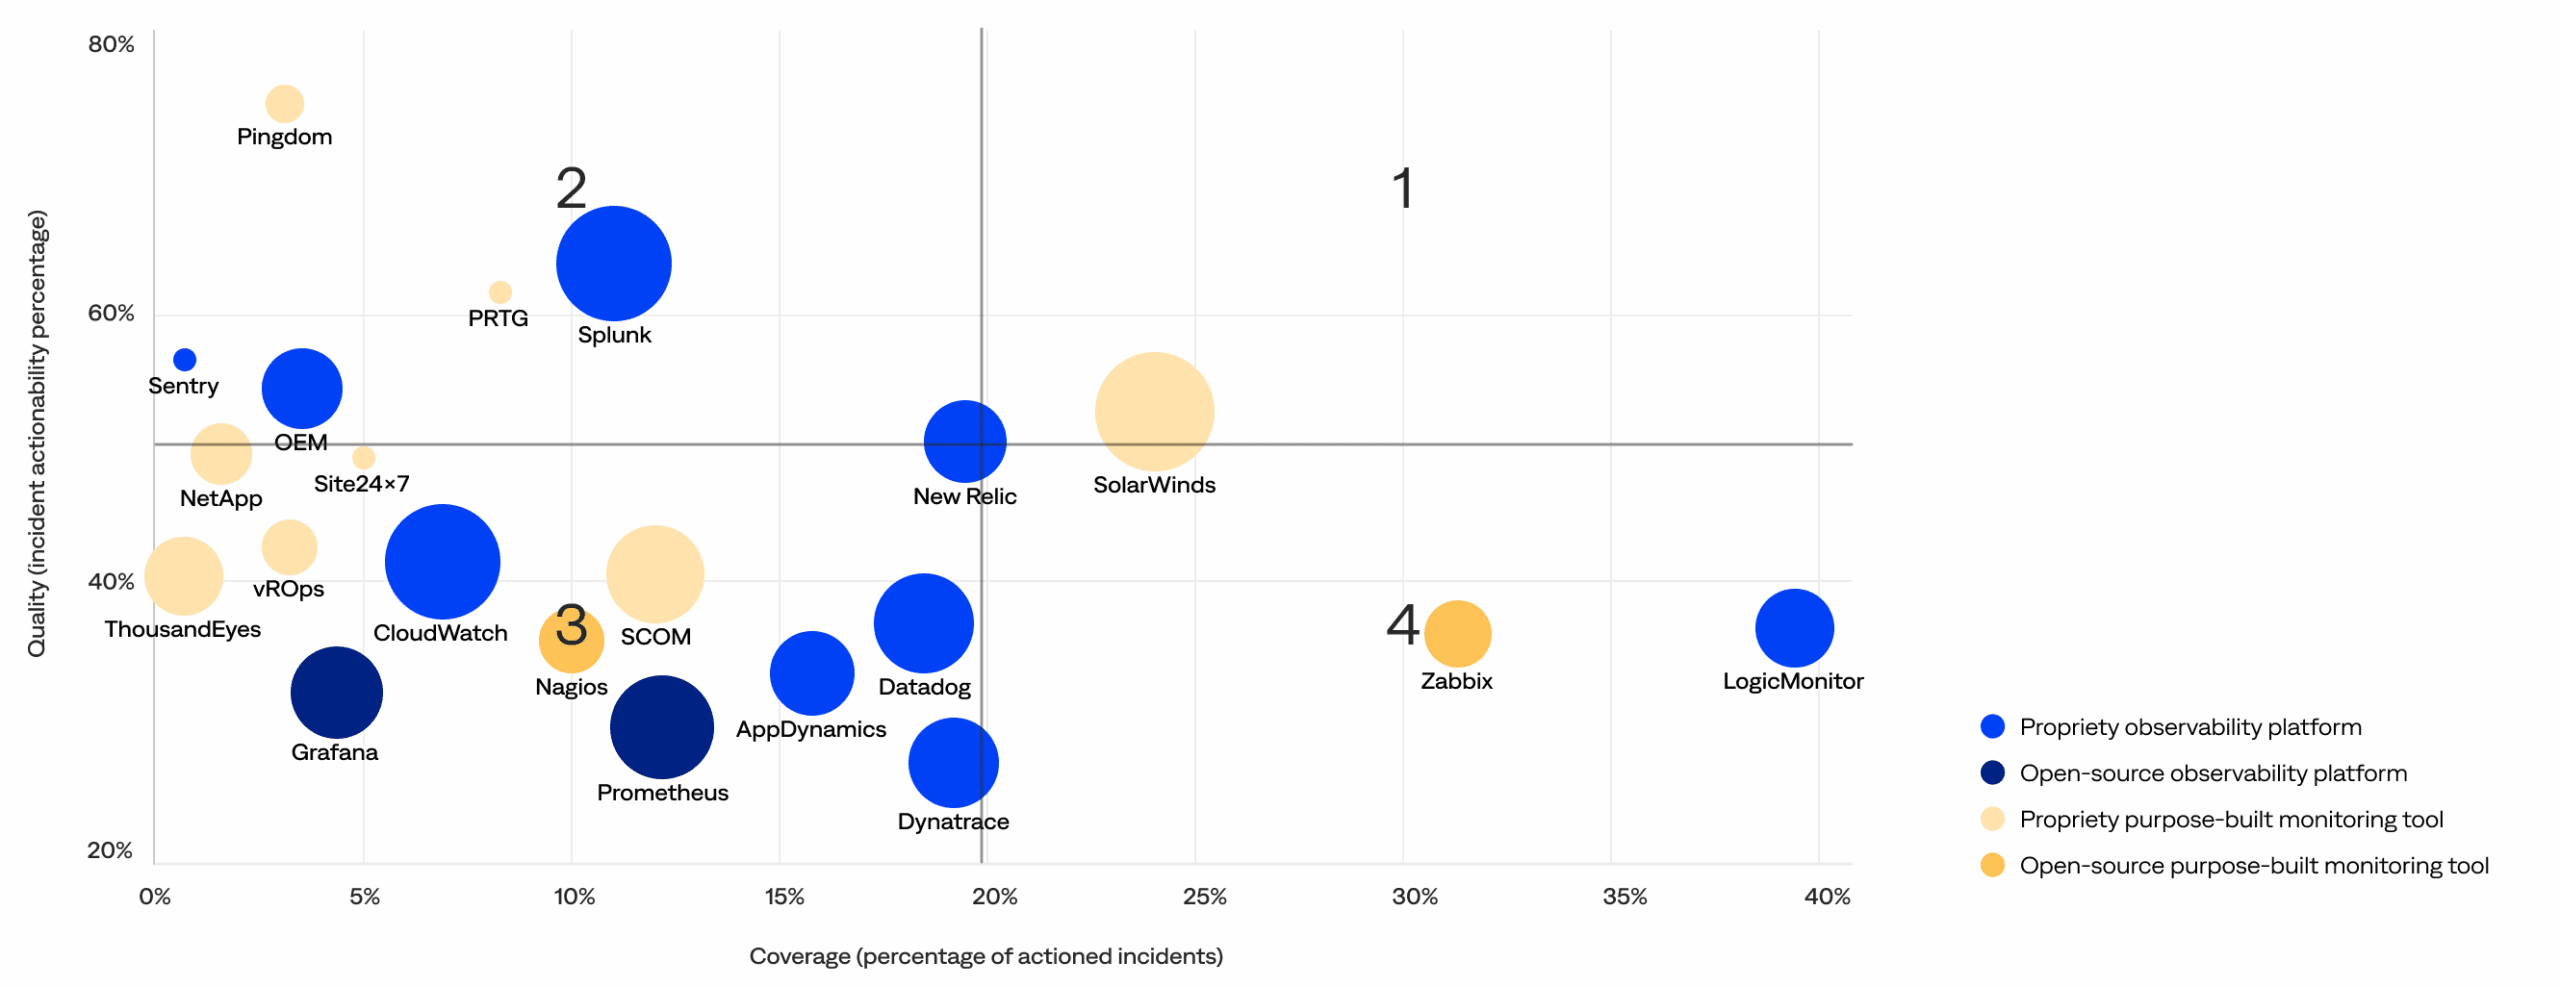
Monitoring and observability tool effectiveness matrix (bubble size increases with customer usage)
Top 4 monitoring and observability tool trends
The data shows key trends and insights for purpose-built monitoring tools and observability platforms.
No tool wholly owns the top-right quadrant—the observability landscape remains fragmented with no clear leader.
- While tools like New Relic and SolarWinds come closest, there are no clear leaders that combine both widespread usage and consistently high actionability (top-right quadrant).
- This signals that even the strongest platforms have room to grow, and the observability industry is still evolving toward optimal performance at scale.
Open-source tools remain low-impact with limited adoption.
- Open-source tools such as Prometheus and Grafana (dark blue) and Nagios and Zabbix (dark yellow) appear in the lower-left or lower-right quadrants with smaller bubbles and lower signal quality.
- Despite their popularity among developers, most open-source observability platforms and monitoring tools have yet to deliver high-value, enterprise-grade observability outcomes.
Some high-coverage tools fall short on signal quality.
- Tools in the bottom-right quadrant contributed a large share of incidents, indicated by their position far along the coverage axis and their sizable bubble sizes, representing broad adoption.
- However, their lower actionability highlights that high usage does not necessarily translate to high operational value. These scalable but noisy tools may benefit from improved configuration and tuning to reduce noise and enhance the precision of alerts.
Purpose-built monitoring tools tend to align as either specialists or stragglers.
- Purpose-built monitoring tools either fell in the top-left quadrant (optimized, high-performance tools), like PRTG and SolarWinds Pingdom, or the bottom-left quadrant (underutilized tools), with lower adoption and weaker signal quality.
- This indicates that while some purpose-built monitoring tools deliver substantial niche value, others have yet to evolve into broader observability assets.
For organizations investing in observability, the challenge is identifying which tools deserve broader deployment and which require refinement or reevaluation.


- PlatformPlatform
- Agentic IT Operations
- Platform Overview
- AI Detection & Response
- AI Incident Assistant
- AI Incident Prevention
- IT Knowledge Graph
- BigPanda AIOps
- BigPanda Core
- Advanced Insight
- Biggy AI
- Rebranding Matrix
- Integrations
- Security & Compliance
- Features
- Detection
- Open Integration Hub
- Event Correlation
- AI Detection
- Diagnosis
- Service Desk Correlation
- Suggested Actions
- Triage
- Automated Incident Triage
- Root Cause Analysis
- Similar Incidents
- Prevention
- Change Risk Management
- Problem Management