Incidents
An incident in BigPanda consists of correlated alerts that require attention, such as an outage, performance issue, or service degradation.
As raw data is ingested into BigPanda from integrated tools, the platform correlates related alerts into high-level incidents. Incidents in BigPanda provide context to issues and enable teams to identify, triage, and respond to problems quickly before they become severe.
BigPanda consolidates event data from various sources into a single pane of glass for insights into multi-source incident alerts and the IT environment’s overall health. This enables ITOps, incident management, and SRE teams to investigate and analyze incidents, determine their root cause, and take action easily—all from one screen.
The lifecycle of an incident is defined by the lifecycle of the alerts it contains. An incident remains active if at least one of the alerts is active. BigPanda automatically resolves an incident when all its related alerts are resolved and reopens an incident when a related resolved alert becomes active again.
This section reviews the incident volume, the ratio of alerts correlated into incidents, the ratio of events compressed into incidents, and the environments per organization.
Key incident highlights:
Incident volume
This section reviews the annual incident volume, the annual incident volume by industry, and the daily incident volume for the organizations included in this report.
Annual incident volume
BigPanda generated nearly 132 million incidents in 2024, or over 131 million incidents per year after filtering out the five event outliers. The median was 177,949 incidents per year per organization.
-
- Over three-quarters (76%) of organizations experienced between 25,000 and 1 million incidents per year (low-medium to high annual incident volume), which indicates that most were actively using the platform to manage meaningful incident flow.
- Nearly two-thirds (63%) experienced at least 100,000 incidents per year.
- Almost half (45%) experienced 250,000 or more incidents per year (high to extremely high), including a small but meaningful group (18%) that experienced 1 million or more (very high to extremely high annual incident volume).
- Over a quarter (26%) experienced 250,000 to 1 million incidents per year (high annual incident volume), the largest group.
- Just 6% experienced fewer than 25,000 incidents per year (low to very low annual incident volume), likely onboarding organizations.
of organizations experienced 250K+ incidents per year
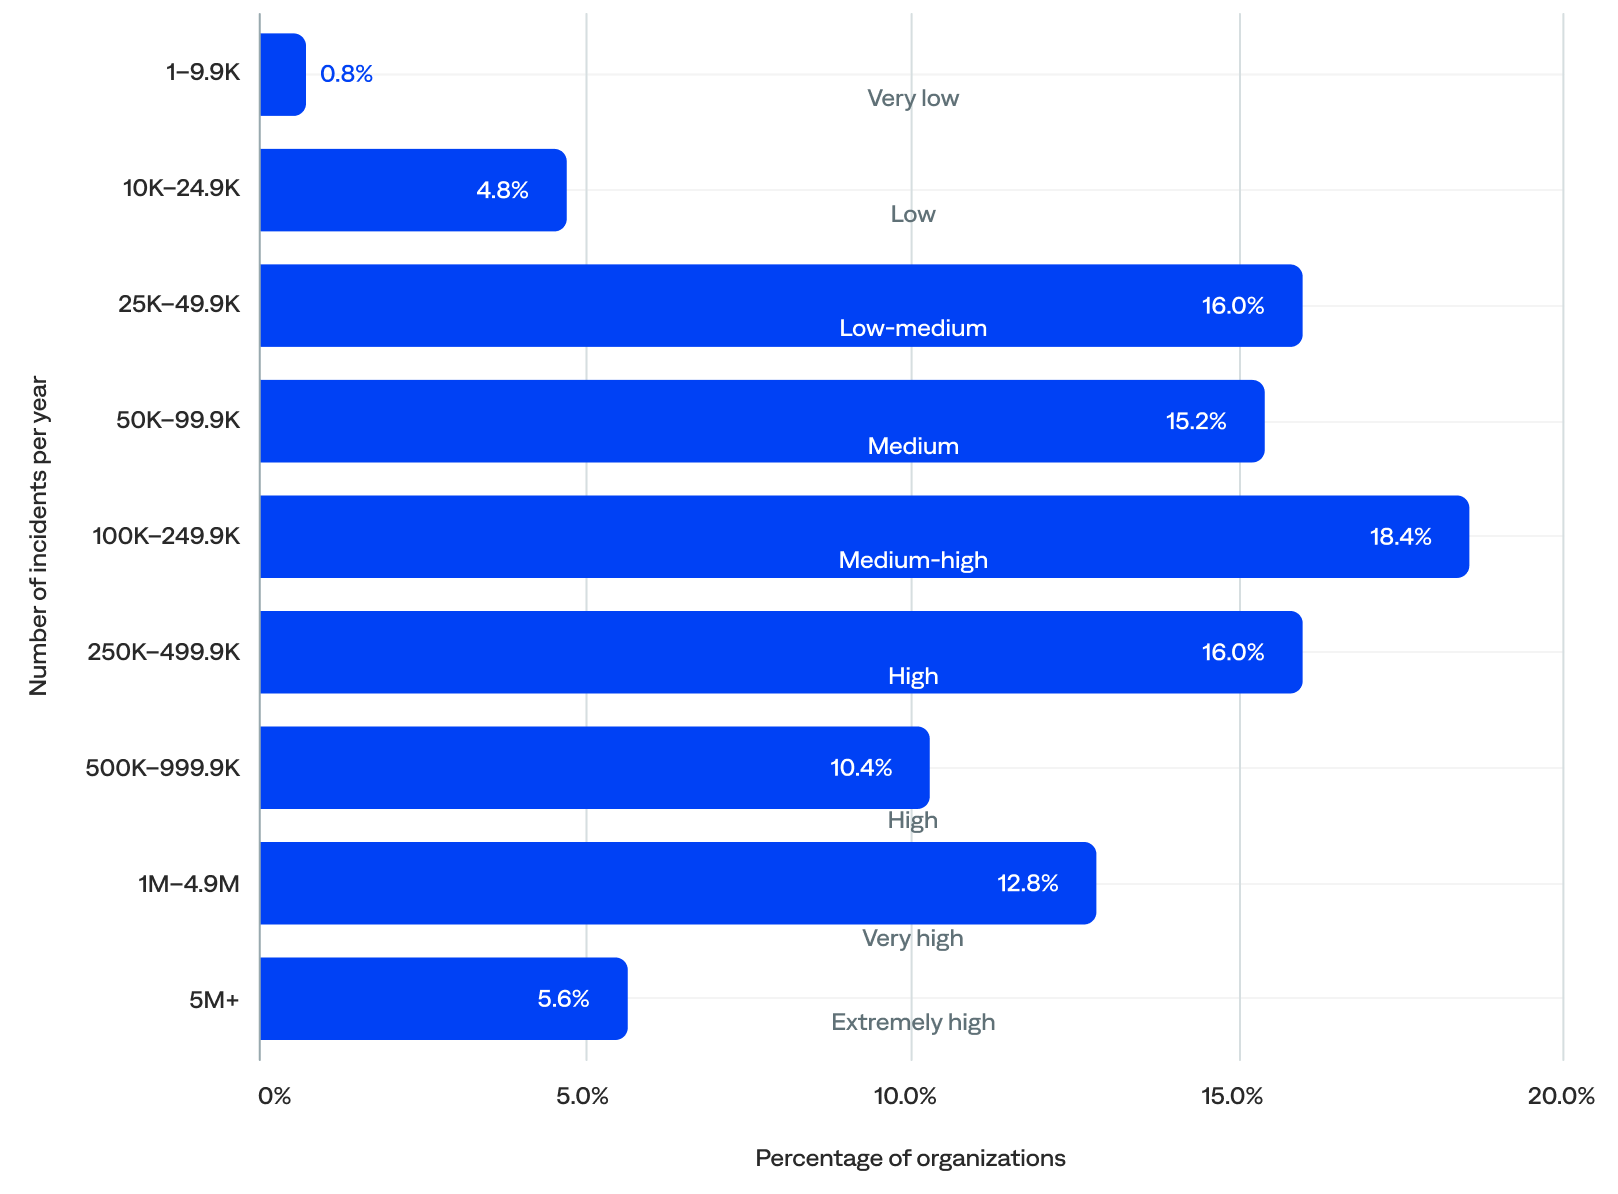
Annual incident volume (n=125)
Annual incident volume by industry
Looking at the median annual incident volume per organization by industry, the data showed that:
- Transportation organizations experienced the most annual incidents (1,199,234), followed by hospitality (711,851), telecommunications (629,295), energy/utilities (572,142), and financial services (400,824).
- Excluding the other industry category, managed service provider organizations experienced the fewest annual incidents (79,011), followed by media/entertainment (98,431), insurance (119,607), retail (123,619), and manufacturing (152,107).
Comparing the median to the mean (average) shows that:
- Financial services and insurance organizations had the biggest drops from mean to median, suggesting their means were very inflated by outliers. These organizations were likely highly variable, from niche players to massive global banks and insurers.
- The median incidents for transportation, hospitality, and energy/utilities organizations were notably higher than the mean. This suggests these sectors had more consistent usage across organizations and operated at scale (not just a few big players).
- The median incidents for telecommunications and managed service provider organizations were much lower than the mean, hinting at a heavy skew from a few power users.
- The median healthcare, technology, and media/entertainment organization incidents were relatively close, indicating uniform adoption patterns and more stability.
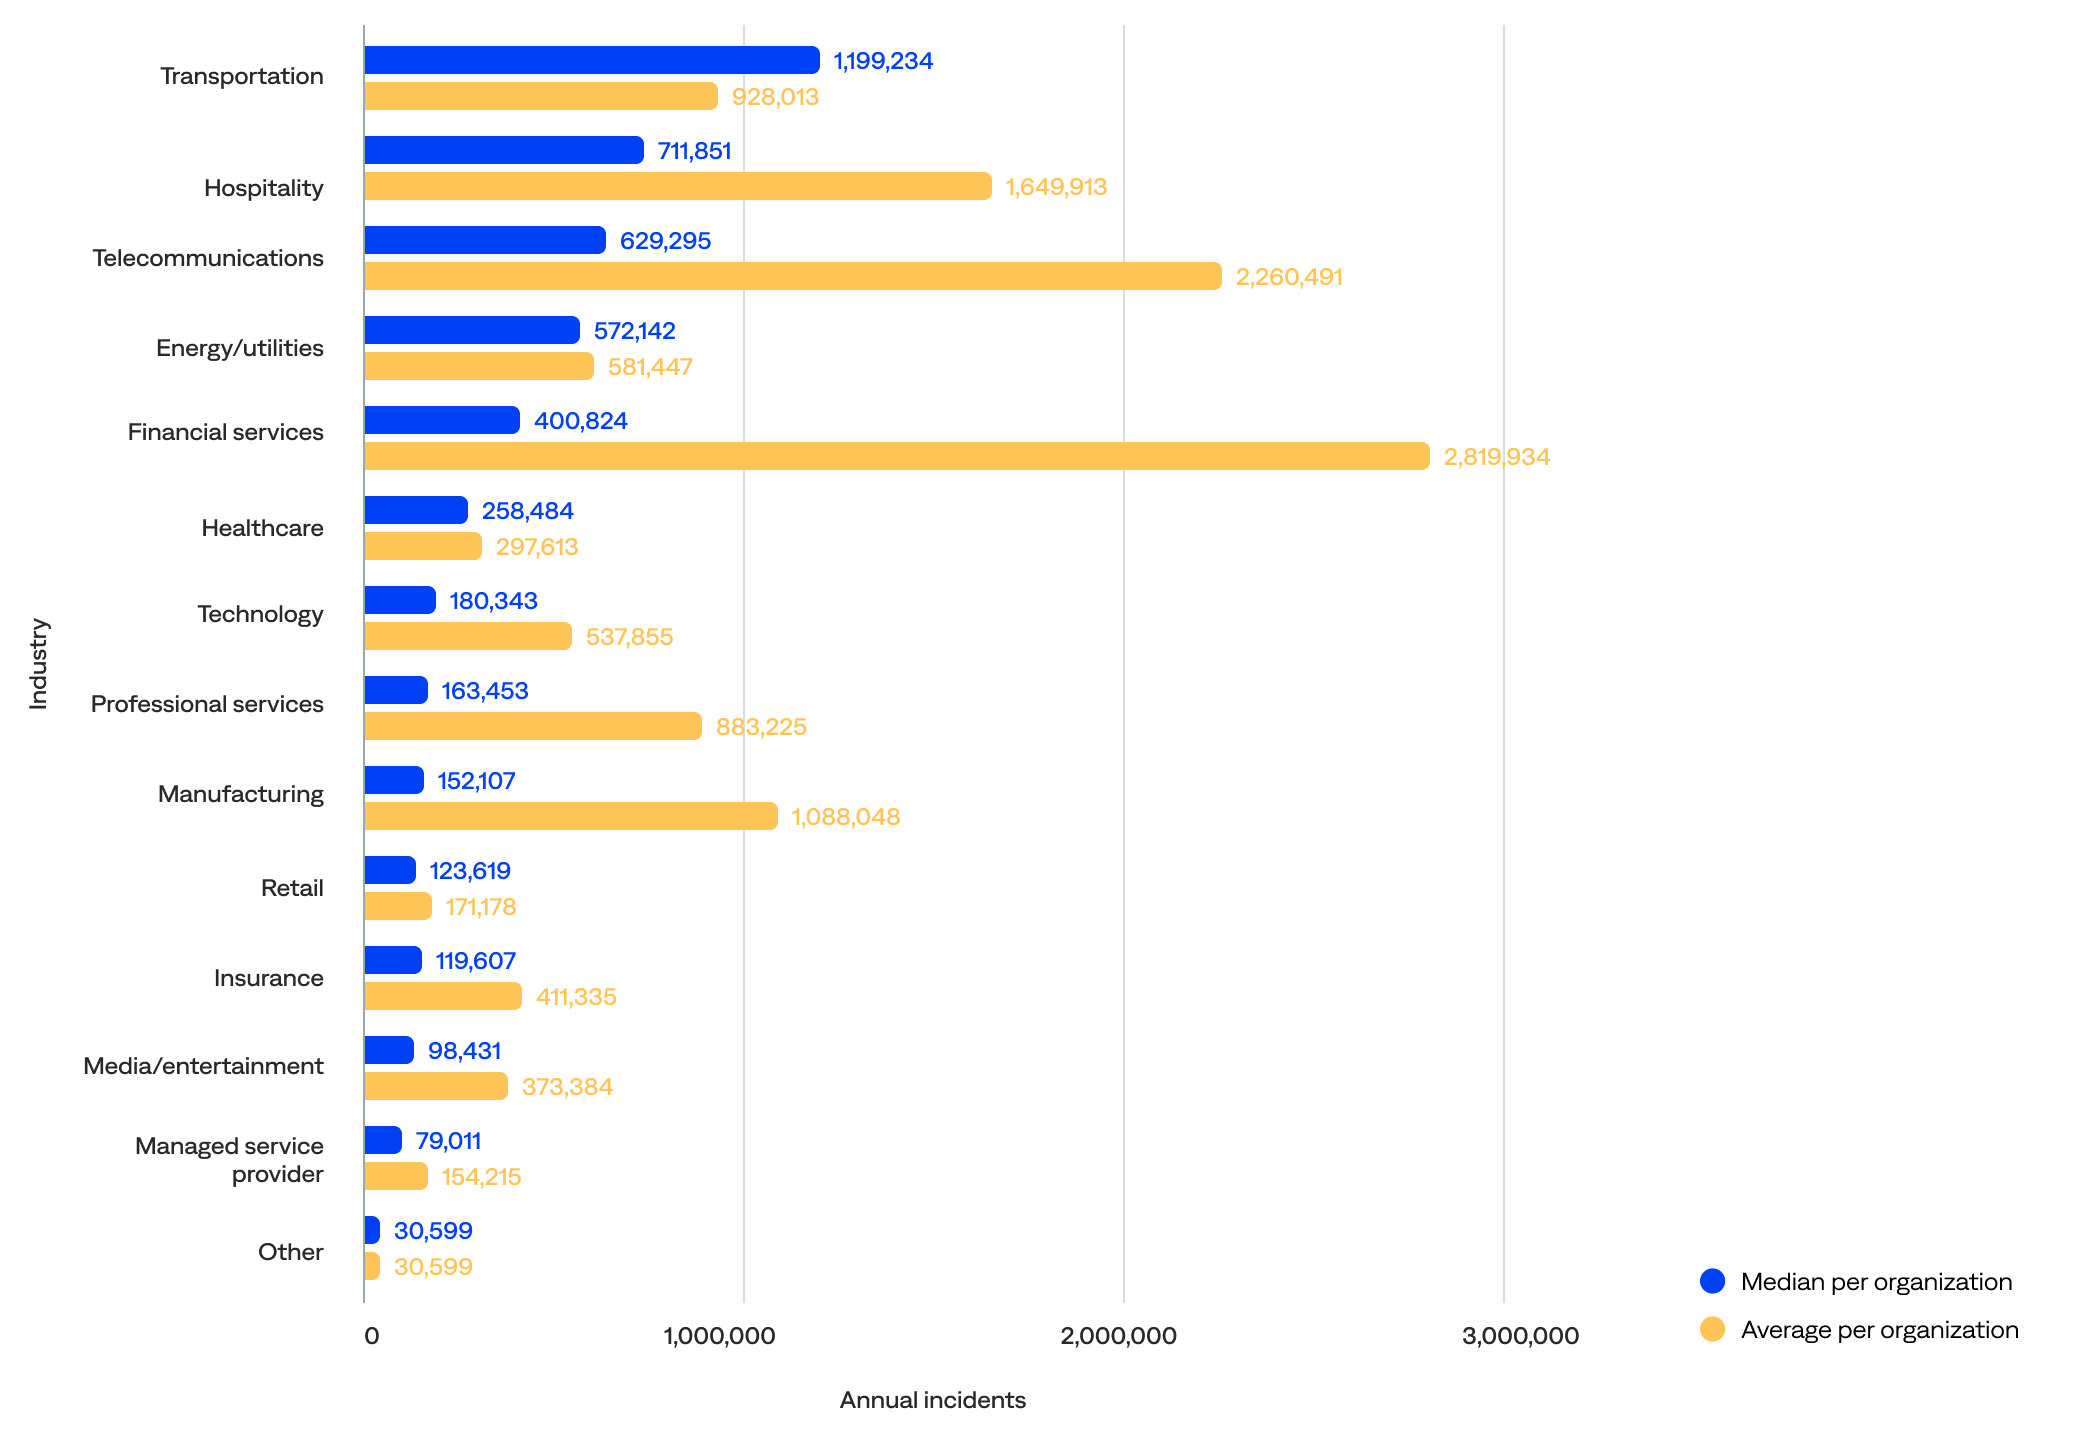
Median and average annual incident volume per organization by industry (n=125)
Daily incident volume
The median daily incident volume was 545 incidents per day. After excluding the 3% of organizations with more than 25,000 incidents per day (outliers), the median barely shifts (from 545 to 494), reinforcing that most organizations remain in the low-to-medium range.
- Over half (51%) of organizations generated 100–999 daily incidents (low-medium, medium, and medium-high daily incident volume). In other words, most organizations experienced fewer than 1,000 incidents per day.
- Over a third (37%) experienced 1,000 or more daily incidents (high-to-extremely-high daily incident volume).
- The remaining 12% experienced fewer than 100 incidents per day (very-low-to-low daily incident volume), likely including onboarding organizations.
of organizations experienced 500+ incidents per day
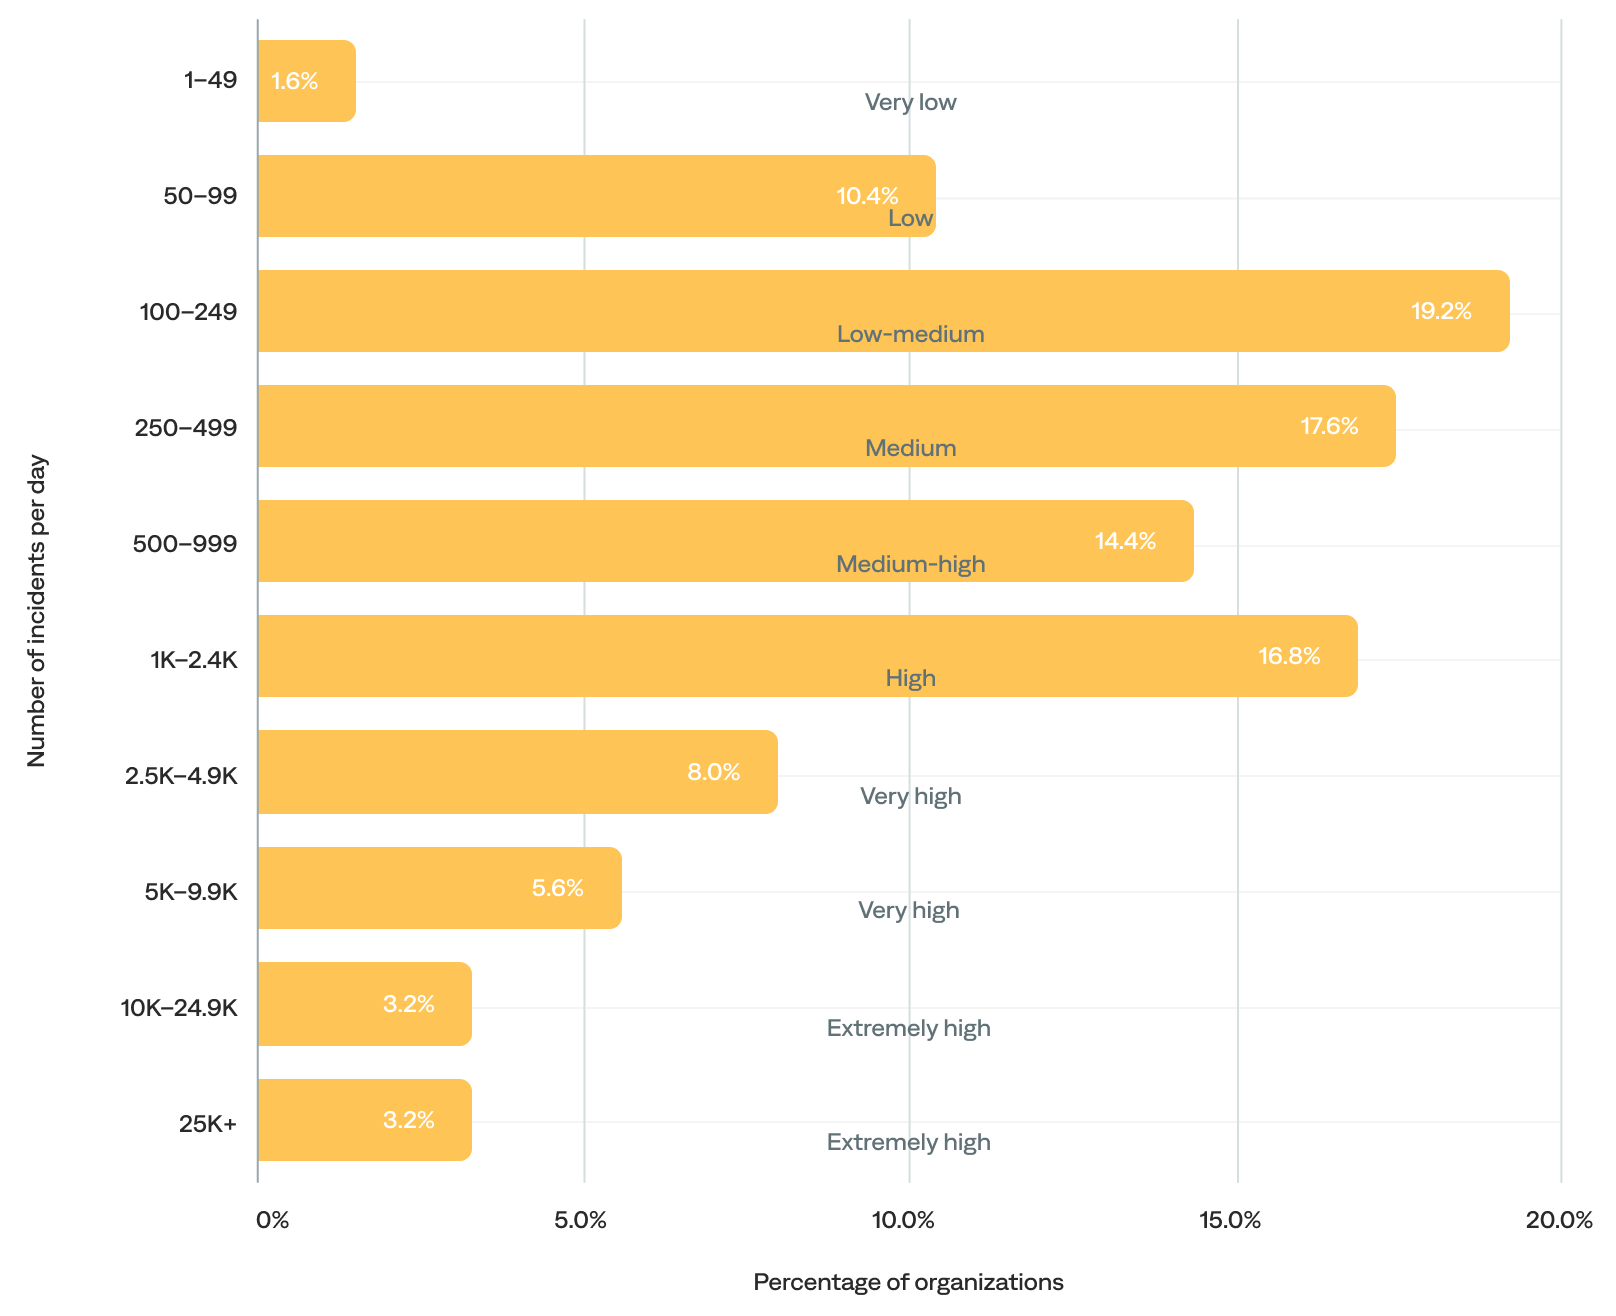
Daily incident volume (n=125)
Alert correlation rate
Alert correlation, also known as event correlation, uses correlation patterns to consolidate alerts from external observability and monitoring tools, significantly reducing alert noise and giving teams actionable insights to resolve incidents before they become outages. The alert-to-incident correlation rate is the percentage of alerts correlated into incidents.
A healthy alert-to-incident correlation rate range is 40–75%. Anything under 40% usually leaves something on the table; anything over 75% usually means too much correlation. It’s a delicate balance.
The median alert-to-incident correlation rate was 67%.
- About half (49%) had a healthy alert-to-incident correlation rate (40–75%).
- Over a third (38%) had a high alert-to-incident correlation rate (75% or more).
- Only 14% had a low alert-to-incident correlation rate (less than 40%).
of organizations had a healthy alert correlation rate (40–75%)
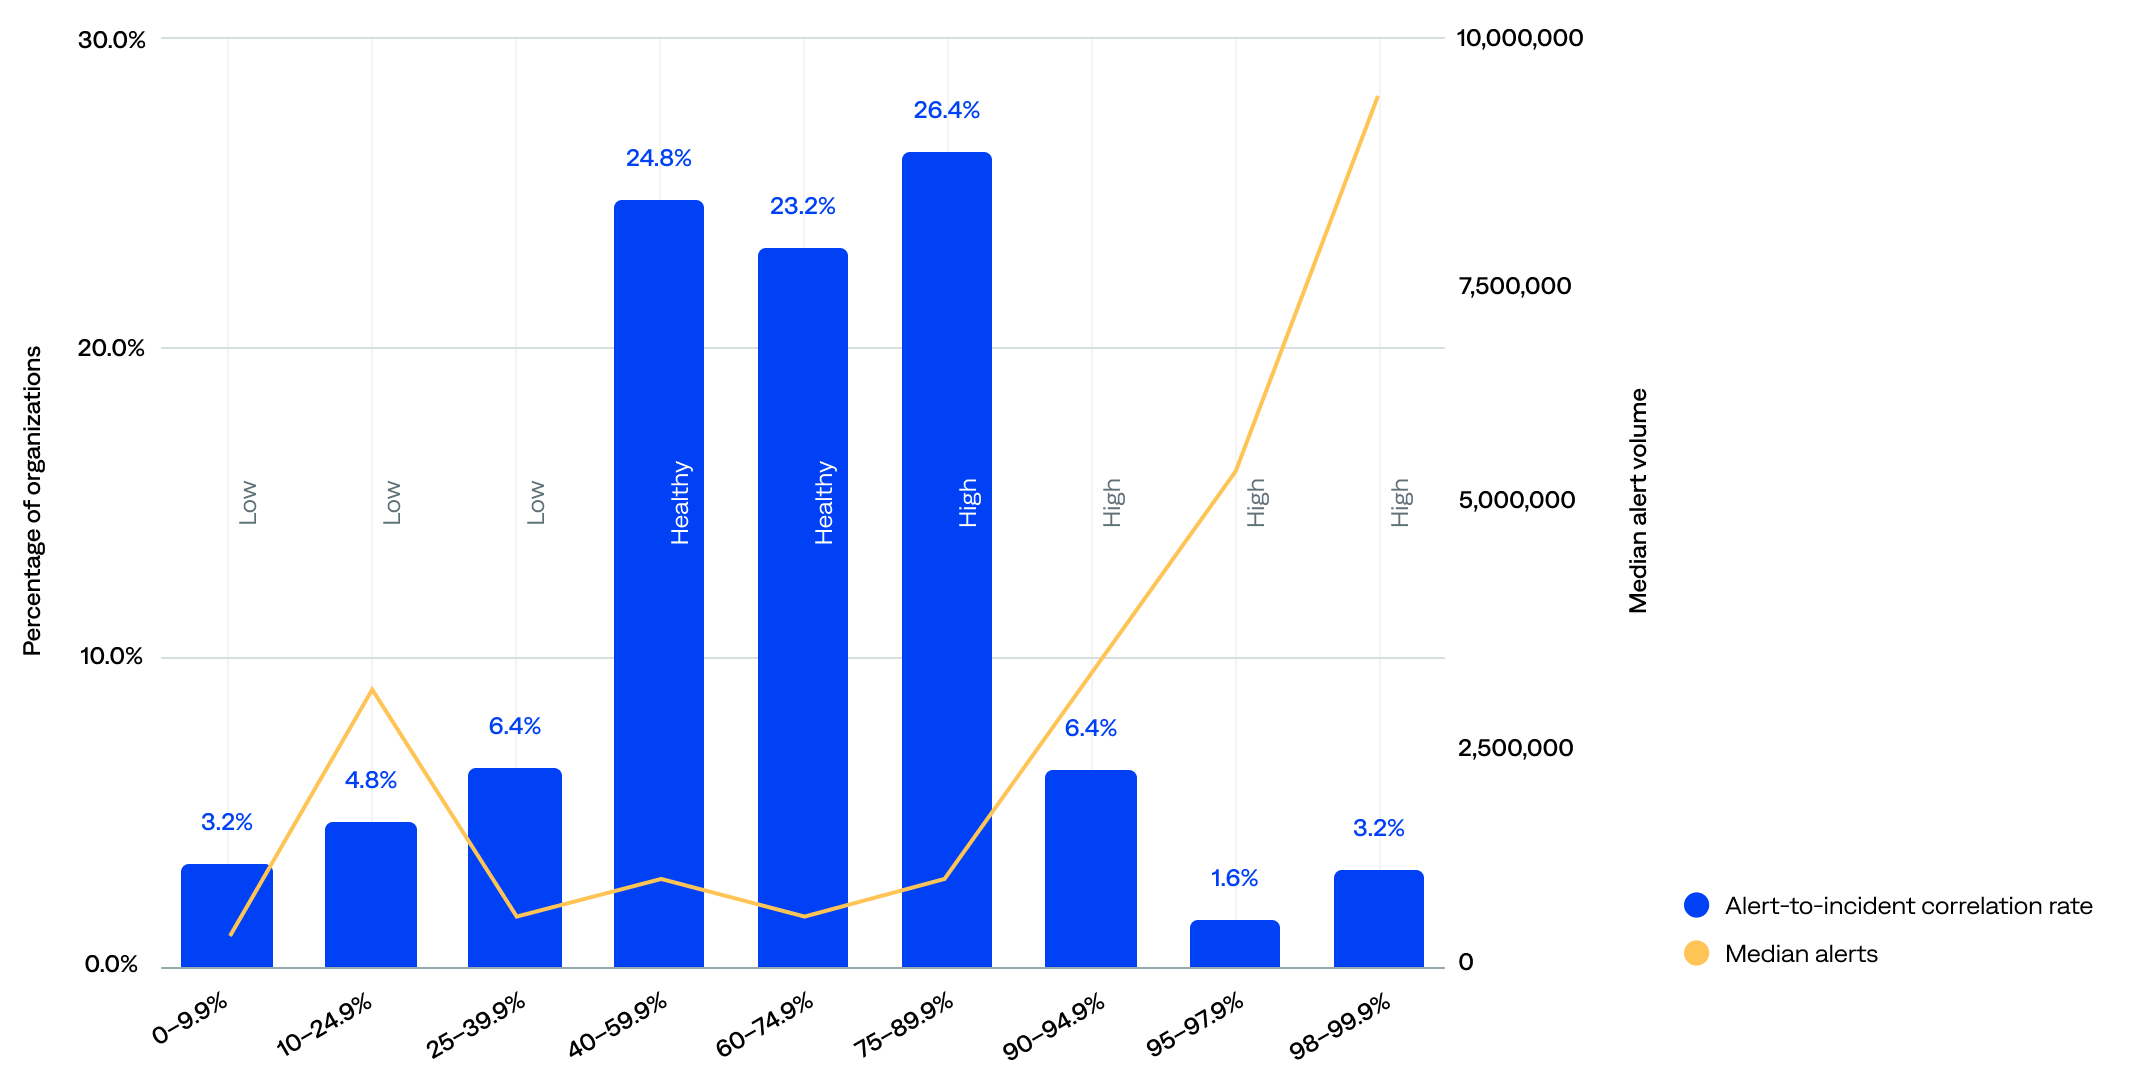
Alert-to-incident compression rate compared to median event volume (n=125)
The data show that alert volume alone does not determine correlation efficiency. Still, there’s a mild tendency for organizations with a high volume of alerts to achieve better correlation, likely due to operational scale.
Incident compression rate
The incident compression rate, sometimes called just compression or compression rate, is the percentage of events compressed into incidents (event-to-incident compression rate).
The event-to-incident compression rate ranged from 70.9% to 99.9%, and the median was 97.3%.
- Most (72%) organizations achieved a strong event-to-incident compression rate of 95% or more—including 30% with a very high rate of 98.5% or more—signaling that event deduplication and correlation work well for the majority.
- One in five (20%) had high event volumes and respectable (medium) compression rate of 85–94.9%, indicating they likely have strong rules but might benefit from fine-tuning.
- Only 8% had a very-low-to-low event-to-incident compression rate of below 85%. However, the 70–79.9% range, while tiny at just 4%, had a surprisingly high median event volume, suggesting missed correlation opportunities, noisy environments, or onboarding organizations.
of organizations achieved a strong incident compression rate (95+%)
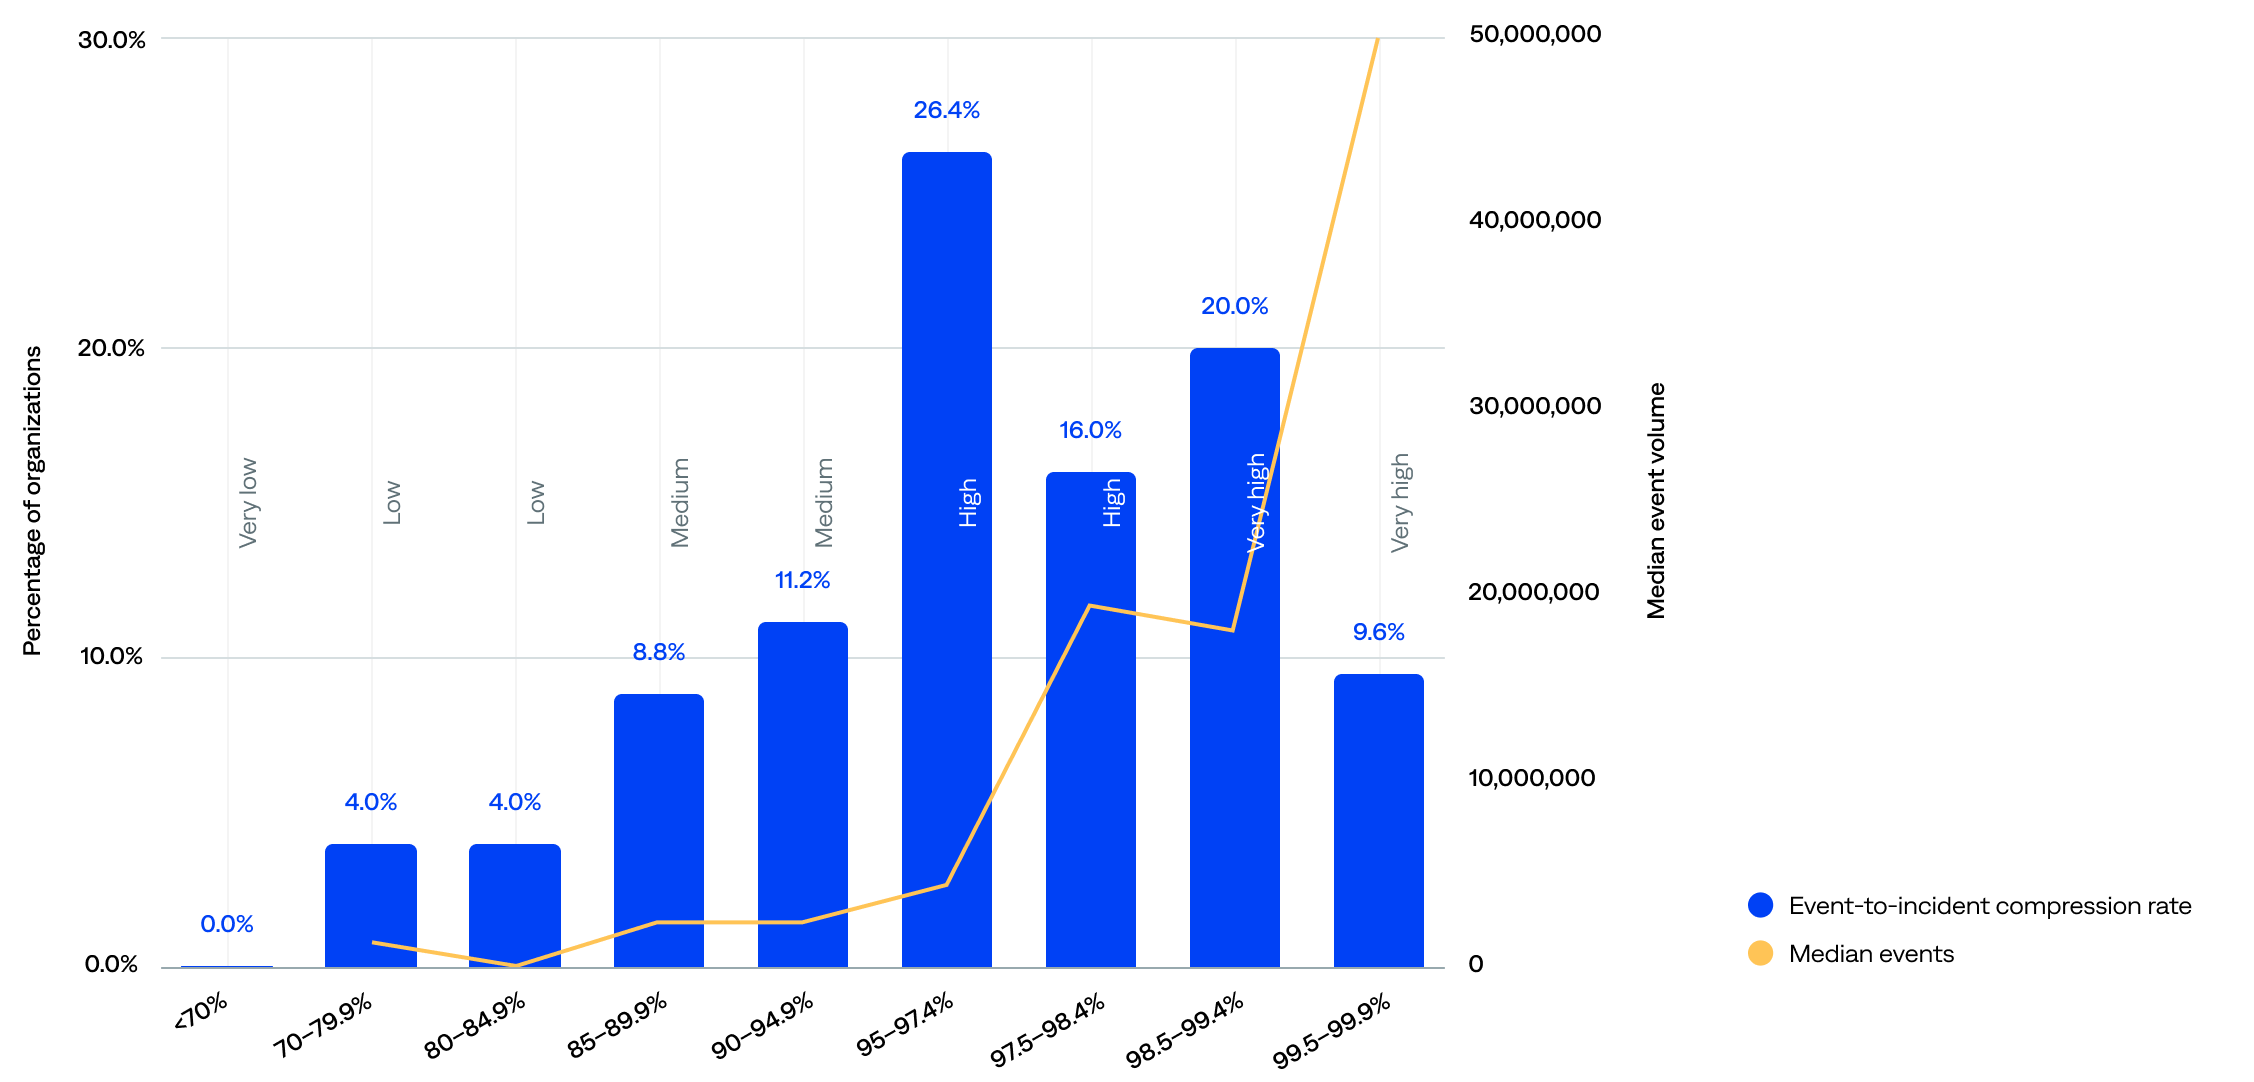
Event-to-incident compression rate compared to median event volume (n=125)
The median event volume did not always correlate with the compression rate range. For example, organizations in the 97.5–98.4% range compressed more efficiently than those in the 95–97.4% range, yet had a slightly lower event volume. This implies that compression quality is not solely a function of volume; configuration and filtering are likely key drivers.
Environments
In BigPanda, an environment is a configurable view of the IT infrastructure that helps teams focus on specific incident-related information.
Environments filter incidents on properties, such as source and priority, and group them for improved visibility, automation, and action. They are customizable and make it easy for teams to focus on incidents relevant to their role and responsibilities, including filtering the incident feed, creating live dashboards, setting up sharing rules, and simplifying incident searches.
Excluding the five outliers, the median number of environments per organization was 58.
- About three-quarters (74%) of organizations had 26–200 environments, including 34% with 51–100, the largest segment in the distribution. These organizations likely have multiple teams, applications, or regions that require centralized monitoring and incident response capabilities and are candidates for scaling observability and automation.
- Nearly one in five (19%) had 25 or fewer environments, including 4% with 10 or fewer. This may indicate they had simpler environments with fewer assets to monitor, were likely to rely on basic alerting or minimal automation, and had room to grow in segmentation, tagging, and response maturity.
- Just 6% had more than 200 environments. These organizations likely require deep observability, advanced correlation, enrichment, and deduplication, as well as multi-environment analytics and reporting.
of organizations had 50+ environments
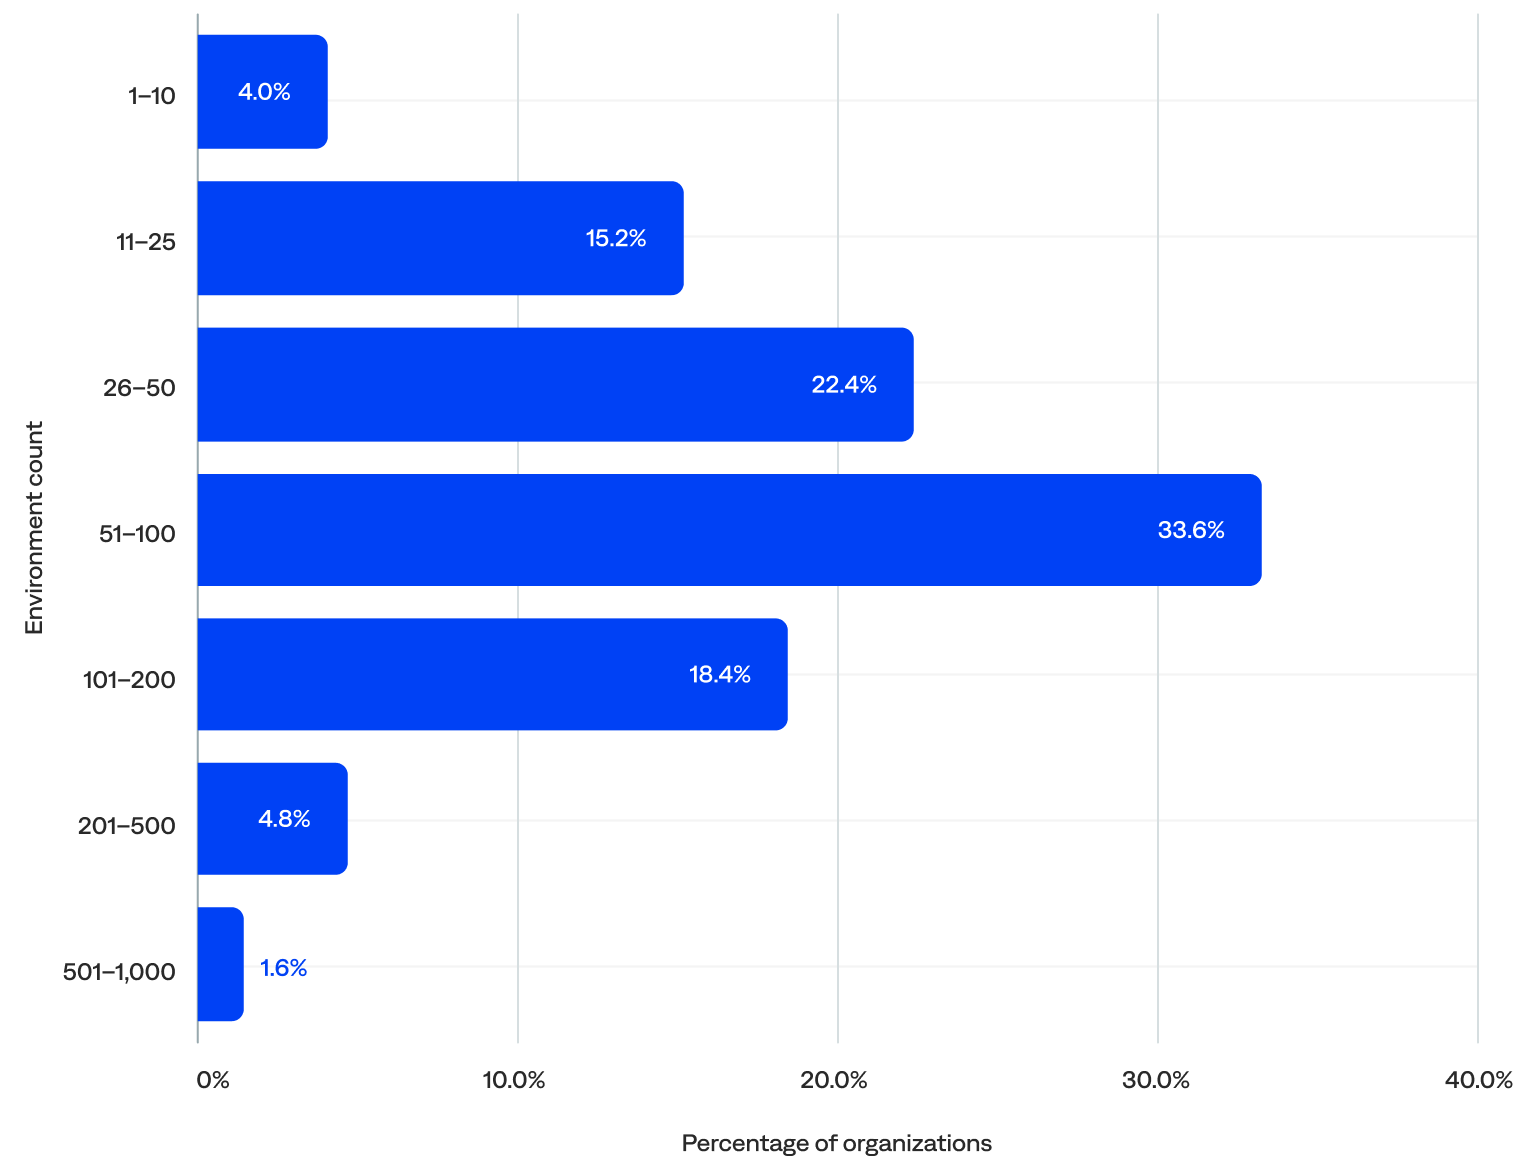
Number of environments per organization (n=125)

- PlatformPlatform
- Agentic IT Operations
- Platform Overview
- AI Detection & Response
- AI Incident Assistant
- AI Incident Prevention
- IT Knowledge Graph
- BigPanda AIOps
- BigPanda Core
- Advanced Insight
- Biggy AI
- Rebranding Matrix
- Integrations
- Security & Compliance
- Features
- Detection
- Open Integration Hub
- Event Correlation
- AI Detection
- Diagnosis
- Service Desk Correlation
- Suggested Actions
- Triage
- Automated Incident Triage
- Root Cause Analysis
- Similar Incidents
- Prevention
- Change Risk Management
- Problem Management