Actioned incidents
Actioned incidents represent outages and system issues that a team member acted on. An action could be a comment, an assignment to a user, a manual share, or an automated share. They are a key metric in determining the efficacy of BigPanda configuration and workflows.
This section reviews the incident volume, actionability rate (incident-to-actioned-incident rate), and noise reduction rate (event-to-actioned-incident rate).
Key actioned incident highlights:
“For us, an alert is not actionable unless it comes into BigPanda, is enriched, and is potentially correlated with the other alerts in the system.”
–Head of Software Engineering, Telecommunications Enterprise
Actioned incident volume
This section reviews the annual actioned incident volume, the annual actioned incident volume by industry, the monthly actioned incident volume, and the daily actioned incident volume.
Annual actioned incident volume
BigPanda generated nearly 20 million actioned incidents in 2024 for the organizations included in this report. After filtering out the five event outliers, there were 19.23 million actioned incidents per year. The median was 34,232 actioned incidents per year per organization.
- Two-thirds (66%) of organizations actioned 10,000–249,999 incidents per year (medium-to-high volume), suggesting widespread usage of the BigPanda platform at an operational scale. A third (33%) actioned 10,000–49,999 incidents per year (medium-to-medium-high volume), and the other third (33%) actioned 50,000–249,999 incidents per year (high volume).
- Nearly a quarter (23%) actioned fewer than 10,000 incidents per year (very-low-to-low-medium volume), including 6% with fewer than 1,000, which were likely onboarding organizations.
- Just 11% actioned 250,000 or more incidents per year (very-to-extremely-high volume), including 2% with 1 million or more, representing very large, global enterprises operating with complex business logic.
of organizations actioned 10K–49.9K annual incidents
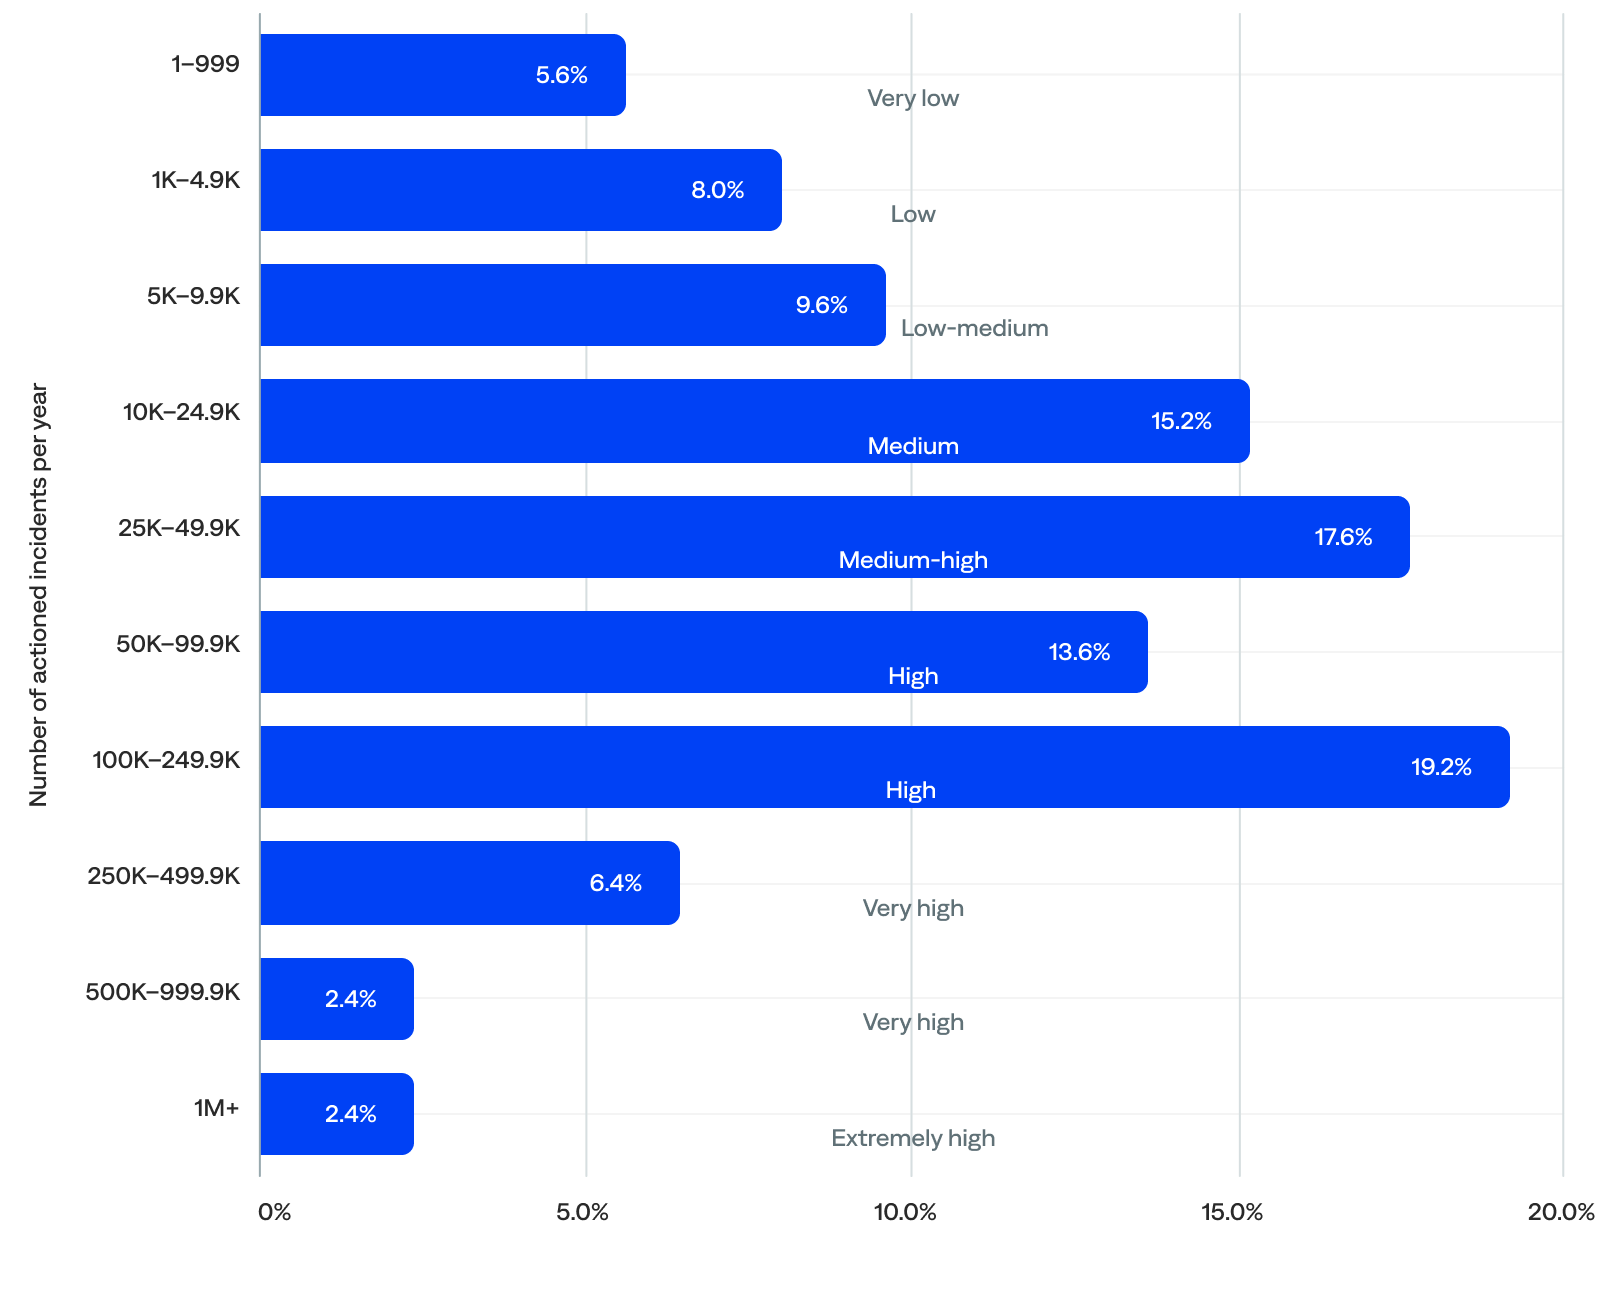
Annual actioned incident volume (n=125)
Annual actioned incident volume by industry
Looking at the median annual actioned incident volume per organization by industry, the data showed that:
- Transportation organizations actioned the most incidents per year (127,702), followed by hospitality (109,993), financial services (86,034), energy/utilities (54,460), and technology (46,856).
- Excluding the other industry category, professional services organizations actioned the fewest incidents per year (24,742), followed by healthcare (26,145), media/entertainment (29,368), managed service providers (31,977), and manufacturing (33,083).
Comparing the median to the mean (average) shows that:
- Financial services organizations had a significant gap between the mean (490,157) and median (86,034) actioned incidents per year, indicating a heavily skewed distribution likely driven by a few very large organizations and wide variability in scale within the sector.
- Transportation was the only industry where the median (127,702) exceeded the mean (121,876), implying that most transportation organizations had fairly consistent usage with a relatively balanced distribution and no extreme outliers.
- The technology and energy/utilities industries showed lower medians (46,856 and 54,460, respectively) than means (118,089 and 107,702, respectively), suggesting a few high-volume organizations lifted the average. Still, most organizations in these industries had lower volumes of actioned incidents.
- Hospitality industries had a high median (109,993) relative to their mean (193,082), indicating a more even usage distribution and leaning toward mature implementations across the organizations.

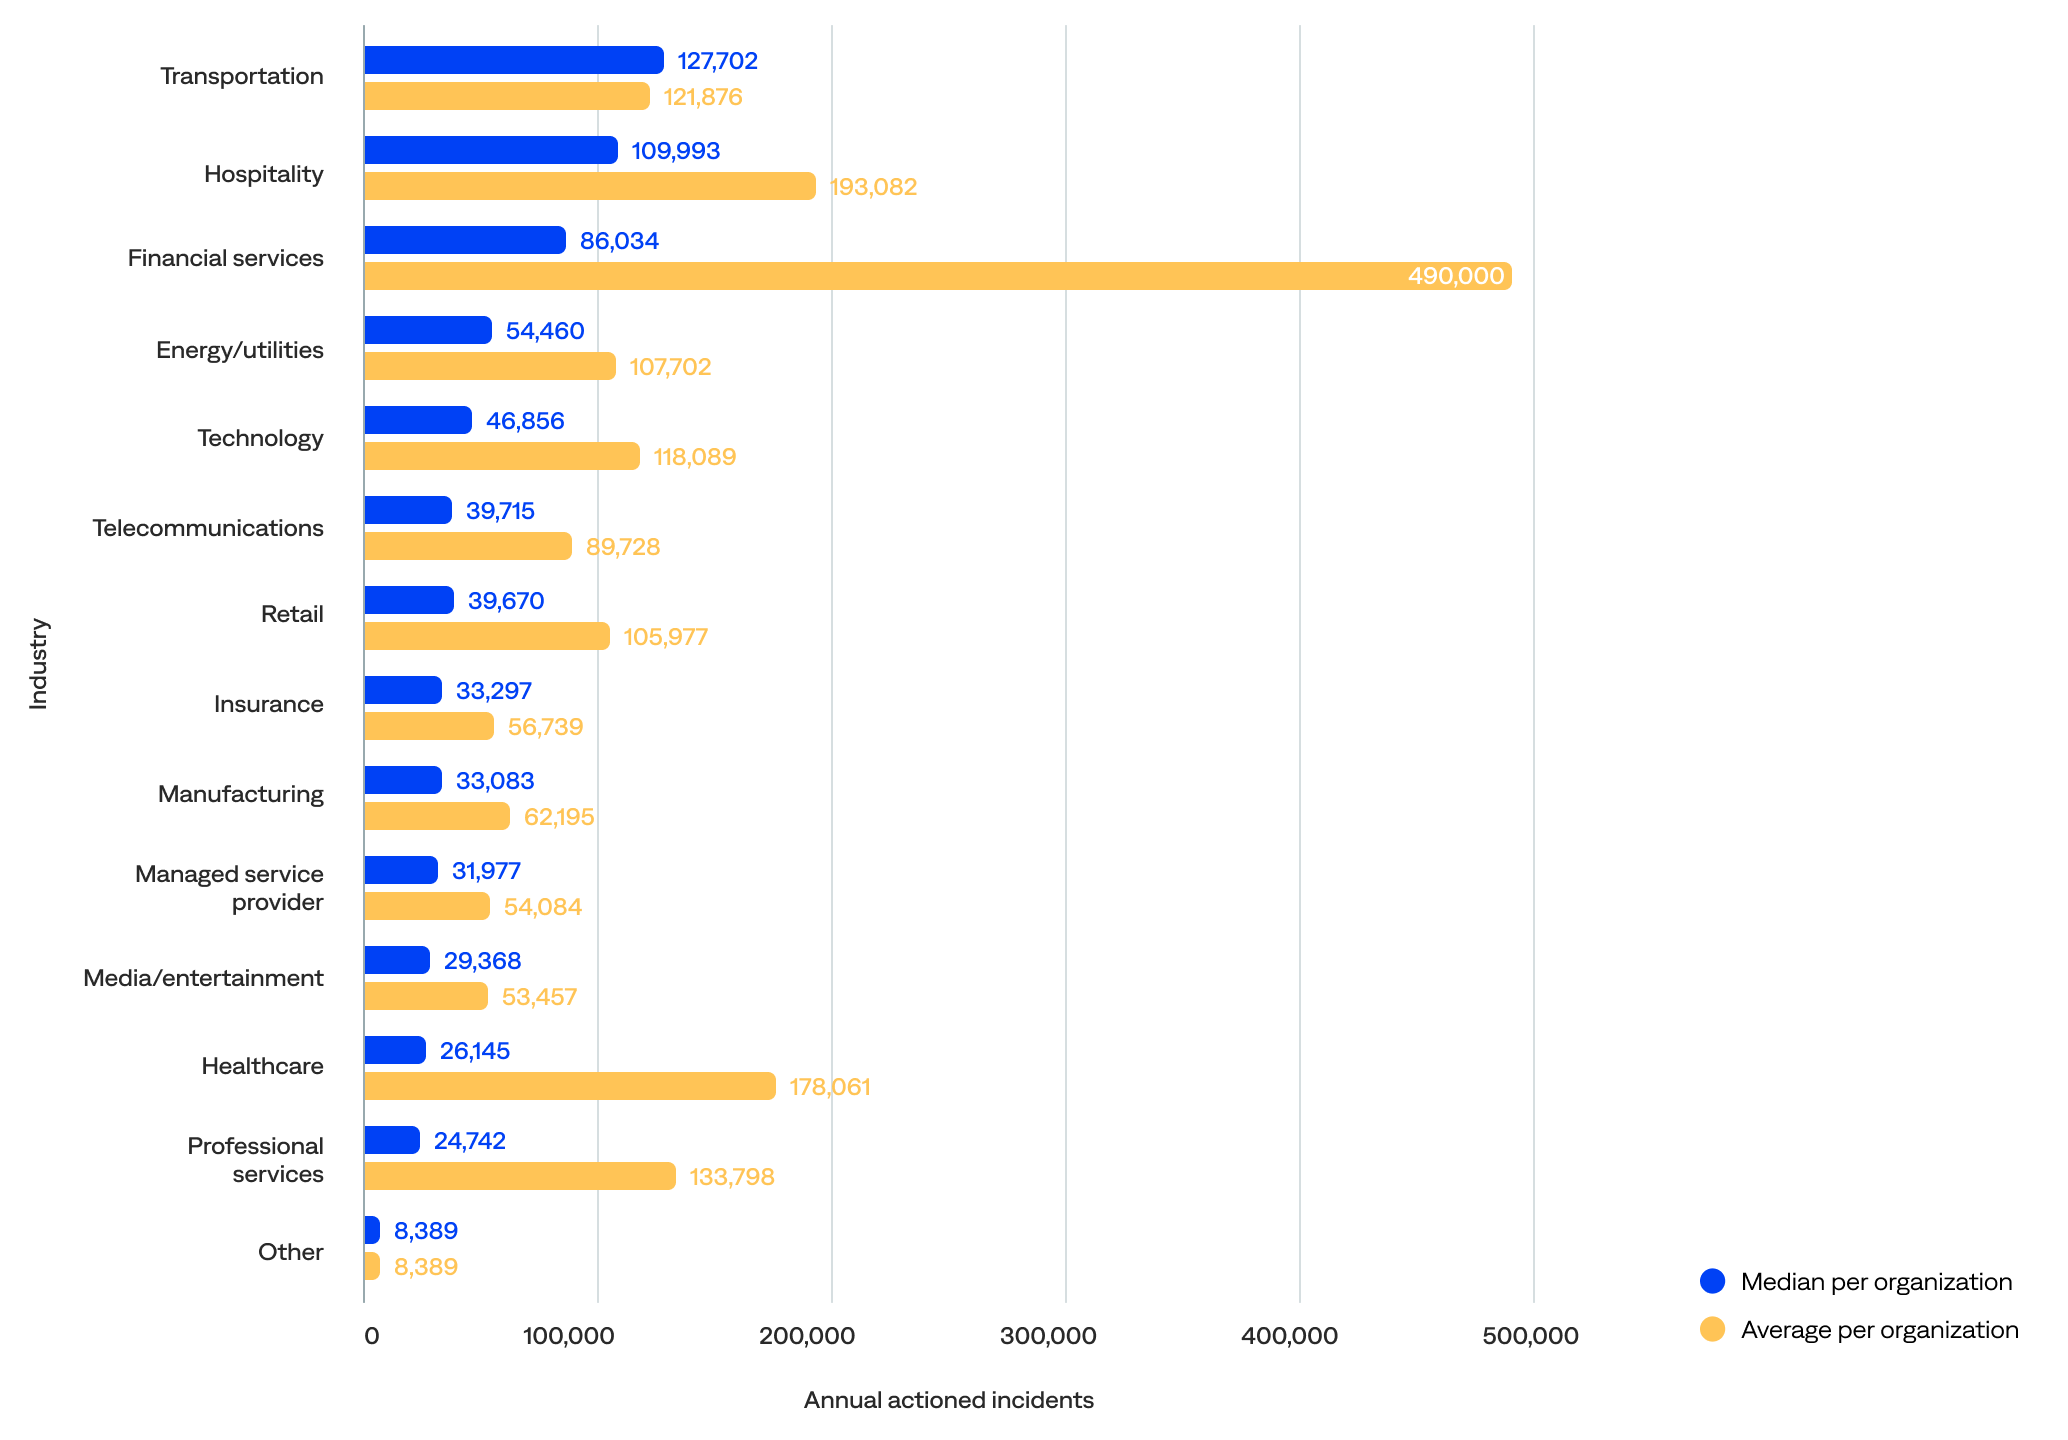
Median and average annual actioned incident volume per organization by industry (n=125)
Monthly actioned incidents (frequency)
When comparing the actioned incident count per month to the event count per month, the data show that:
- The event volume was high but stable, and actioned incidents followed a similar pattern. Both events and actioned incidents peaked in October, suggesting a correlation. In addition, the lowest number of actioned incidents occurred in May, aligning with one of the lower event months.
- The overall shape of both curves was quite aligned, indicating that the alerting or incident workflow responds proportionally to the scale of events. This suggests that the monitoring systems weren’t overloaded or under-triggered in certain months, which is a good sign.
- Even during the high-volume months like July through October, actioned incidents increased steadily but didn’t spike uncontrollably. This could point to effective alert thresholds, deduplication, or noise suppression.
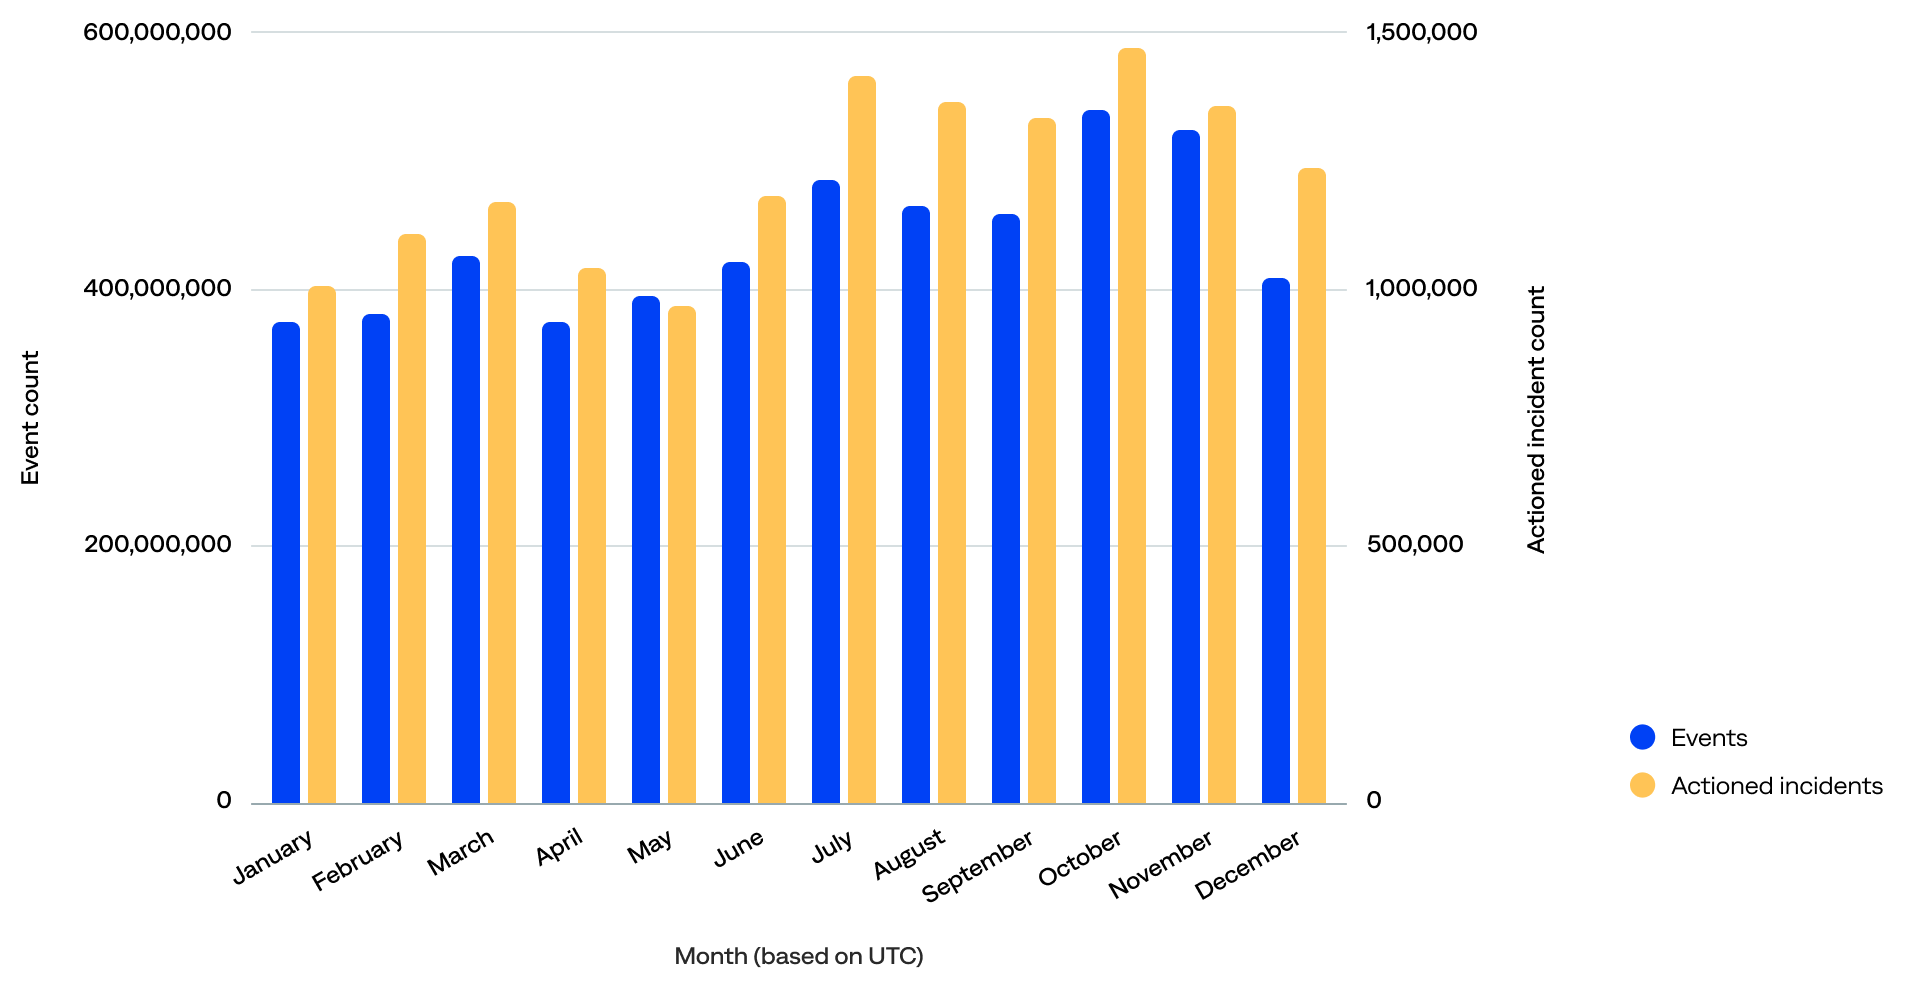
Monthly event count compared to monthly actioned incident count (n=125)
Daily actioned incident volume
BigPanda generated nearly 55,000 actioned incidents per day for the organizations included in this report. After filtering out the five event outliers, there were 53,900 actioned incidents per day. The median was 110 actioned incidents per day per organization.
- Over a third (37%) of organizations actioned 10–99 incidents per day (medium-to-medium-high volume).
- More than a quarter (29%) actioned 100–499 incidents per day (high volume).
- Nearly a quarter (22%) actioned 500 or more incidents per day (very high volume).
- Just 12% actioned fewer than 10 incidents per day (very-low-to-low-medium volume), including 2% with less than daily actioned incidents, likely representing onboarding organizations.
of organizations actioned 500+ incidents per day
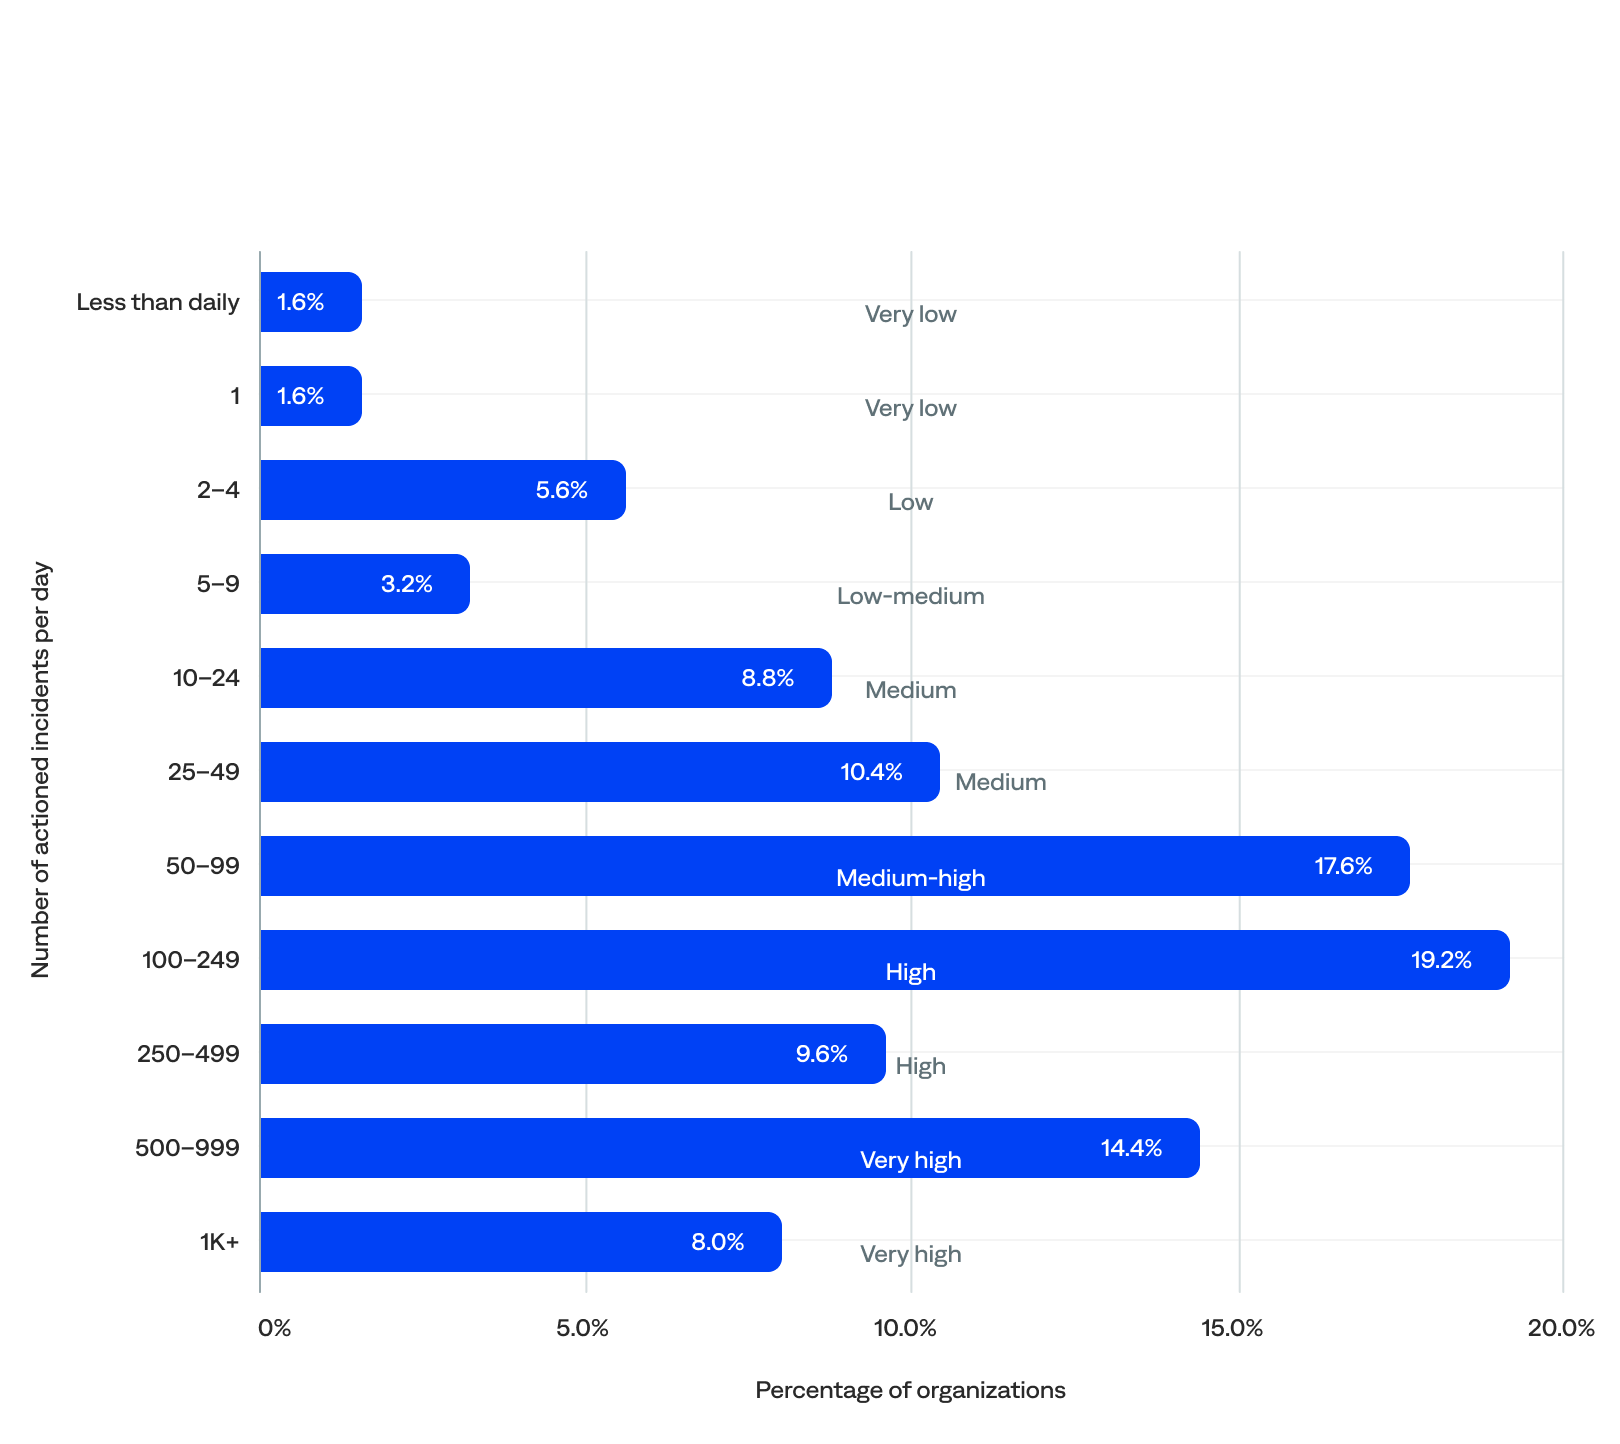
Daily actioned incident volume (n=125)
Actionability rate
The actionability rate is the percentage of incidents that were actioned (incident-to-actioned-incident rate).
Both high and low actionability rates can be good or bad.
- High actionability could mean that an organization has reduced noise by removing incidents that don’t need to be acted on (good), or teams are unnecessarily acting on noisy incidents (bad).
- Low actionability can mean that monitoring and observability tools send a lot of noisy, unactionable events to BigPanda (bad), or teams use BigPanda as an excellent filter to prevent unactionable tickets from being created in the first place (good).
BigPanda customers with incident management teams working in ITSM platforms typically have higher actionability rates because they use BigPanda to reduce, correlate, and ticket immediately. However, most organizations only take action on a very small percentage of incidents because their monitoring and observability tools generate a lot of noise. BigPanda helps them focus only on what’s important.
With BigPanda unified analytics, teams get the visibility and insight they need to differentiate valuable signals from noise and only take action on what matters, reducing overall ticketing and focusing on high-severity and priority incidents. It also helps them pinpoint which monitoring and observability tools provide valuable signals versus which are noisy, so they can filter and ignore the ones that don’t make the cut.

Actionability rate for all organizations
The median actionability rate was 18%.
- Over half (51%) of organizations had a very-low-to-low actionability rate of less than 20%. The lowest actionability ranges had the highest incident volumes, likely due to high alert noise, poor correlation or triage mechanisms, or a lack of automation in incident handling.
- Over a quarter (27%) had a medium-high-to-extremely-high actionability rate of 50% or more, including 19% with 70% or higher and 5% with 90% or higher.
- There was a moderate negative correlation between median incident count and actionability rate; organizations that experienced a higher incident volume often had lower actionability rates, while those with lower incident volumes tended to have higher actionability rates. There’s likely a causal feedback loop. That said, correlation is not causation.
of organizations had a <20% actionability rate
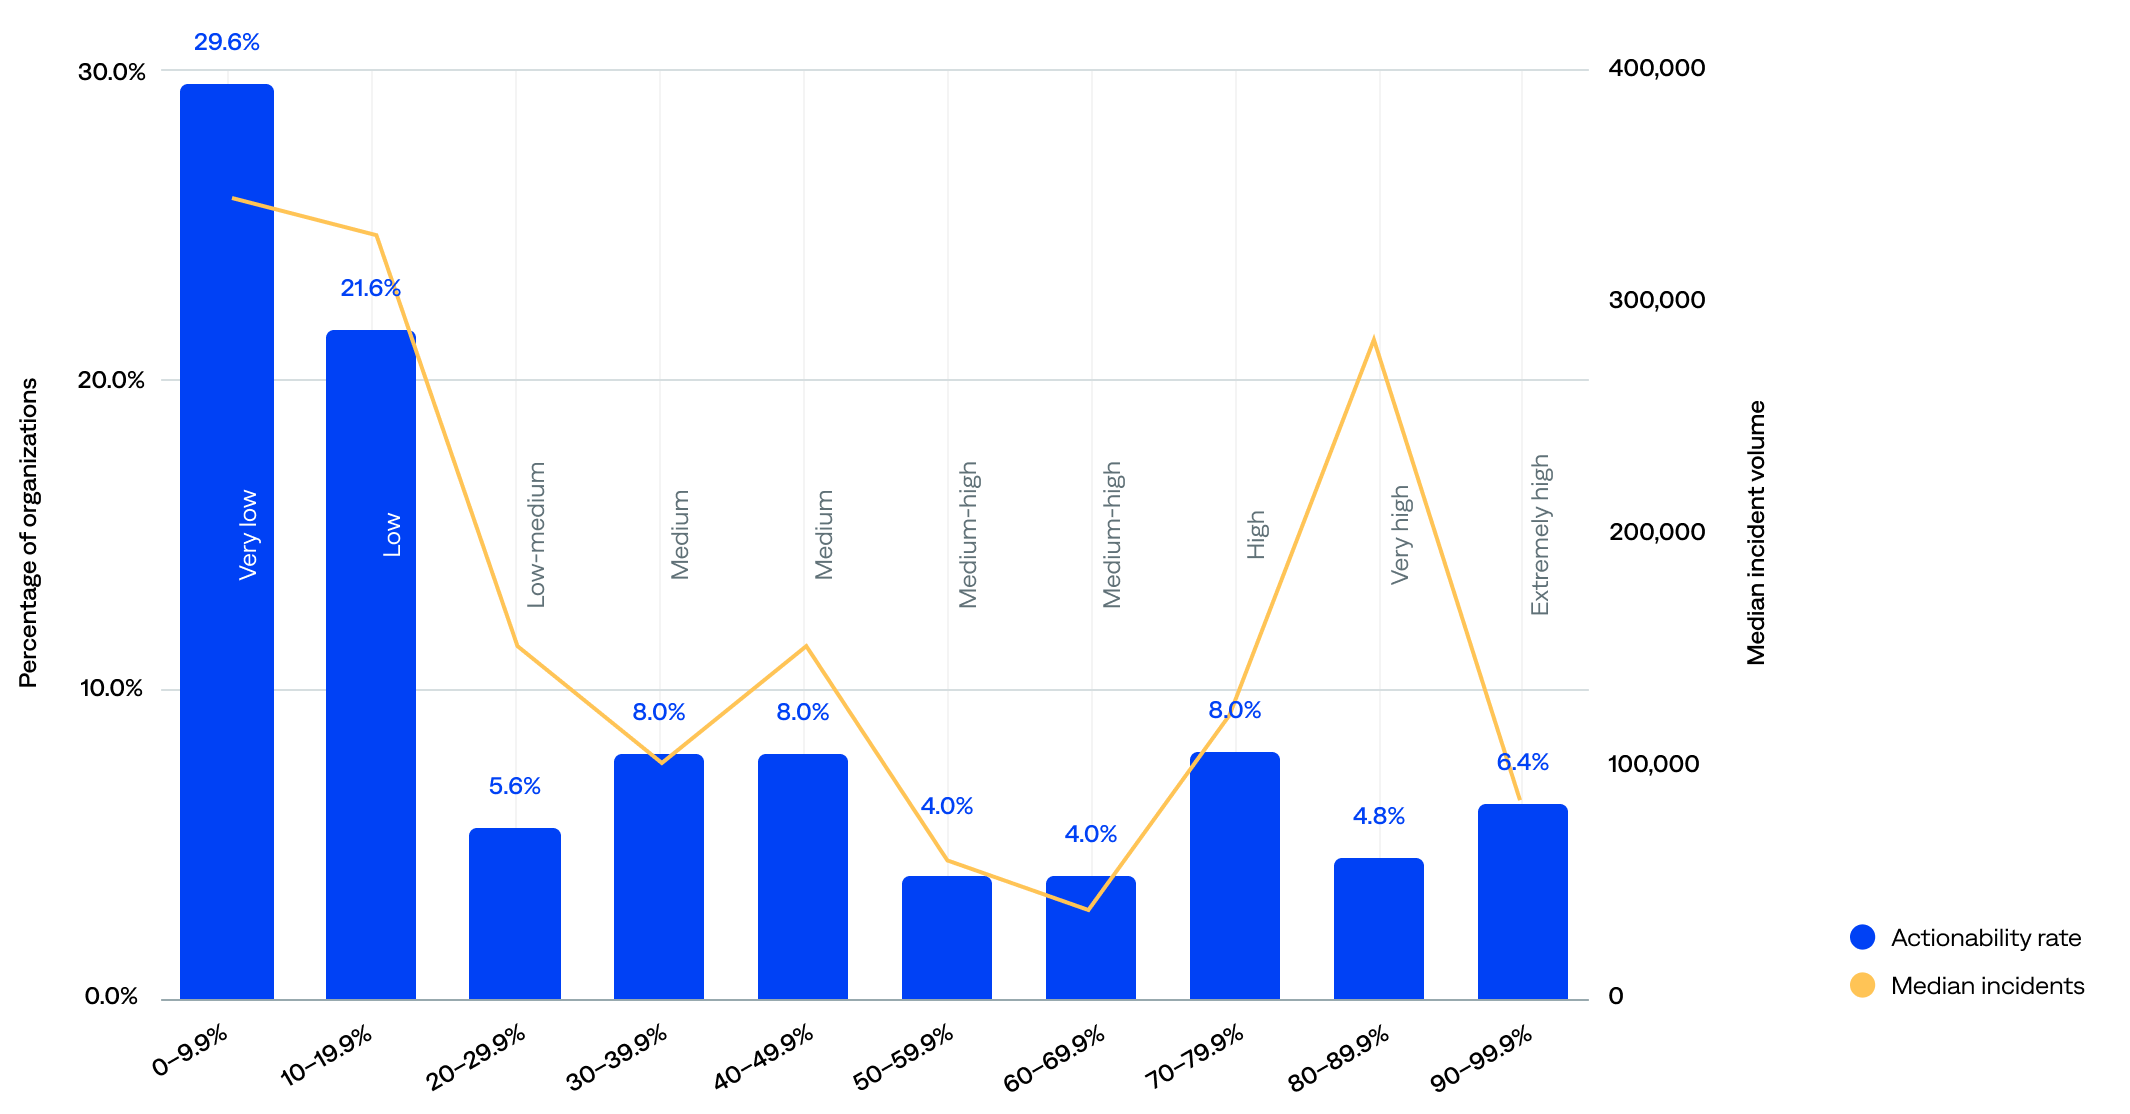
Actionability rate (incident-to-actioned-incident) compared to median incident volume (n=125)
Actionability rate by industry
There are similar patterns when looking at actionability rate and incident volume by industry (higher incident volumes correlate with lower actionability):
- Healthcare organizations had the highest median actionability rate (68%), followed by retail (60%), suggesting strong incident response workflows, effective alert correlation or triage, and possibly narrower, more focused monitoring scopes.
- Telecommunications organizations had the lowest median actionability rate (6%), followed by transportation (11%), and high incident volumes, suggesting they may be overwhelmed by incident load, under-automated, lacking efficient triage, or needing tuning or alert suppression.
- Three industries showed room for optimization, with relatively low incident volumes but average actionability rates: professional services (38%), managed service providers (35%), and media/entertainment (32%).
- Three industries had relatively low incident volumes and low actionability rates: manufacturing (12%), technology (14%), and insurance (17%).
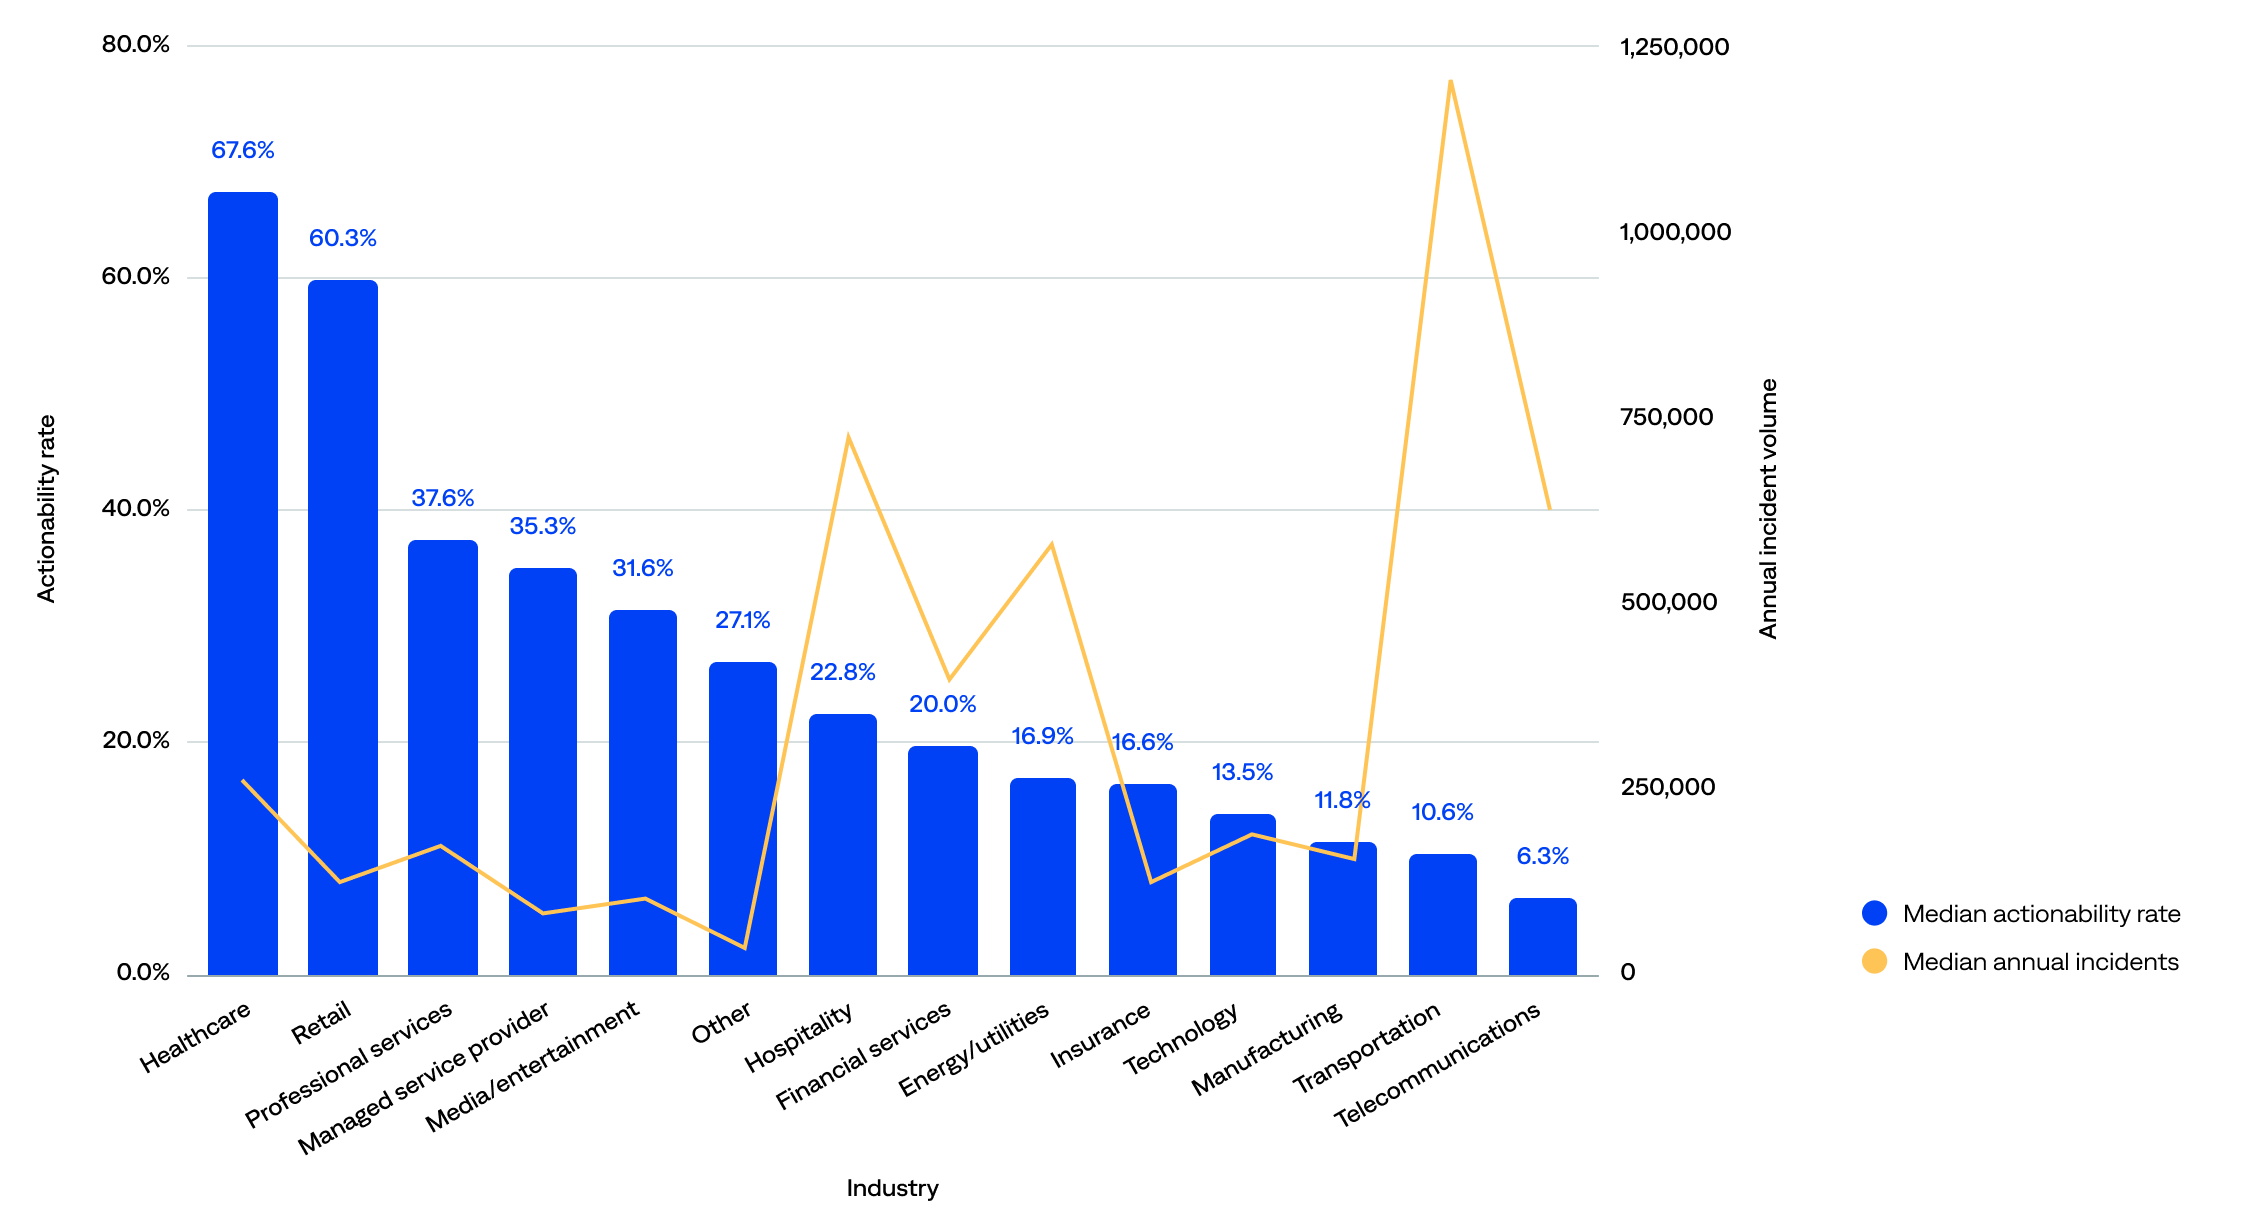
Actionability rate (incident-to-actioned-incident) compared to median incident volume by industry (n=125)
Noise reduction rate
The noise reduction rate is the percentage of raw events that become actioned incidents (event-to-actioned-incident rate or end-to-end noise reduction rate).
The noise reduction rate ranged from 83% to 99.9%, and the median was 99.6%. In other words, they reduced incident-related noise by up to 99.9%, from raw events to actionable incidents—essentially filtering out all but the most critical signals. This supports the earlier finding that most organizations using the BigPanda platform have excellent filtering practices.
- Most (82%) organizations had an exceptionally high noise reduction rate (97% or higher), including 54% with 99.5% or higher and 28% with 99.9%. This points to highly effective correlation, deduplication, and suppression practices among these organizations.
- Only 16% fell into the medium 90–96.9% noise reduction rate range. These organizations likely reduce most noise but still pass a noticeable volume of events through as incidents, indicating opportunities to improve correlation rules or filters and tune alert thresholds or enrichments.
- Just 2% had a noise reduction rate below 90%. These organizations were likely still onboarding.
of organizations had a 99.5+% noise reduction rate
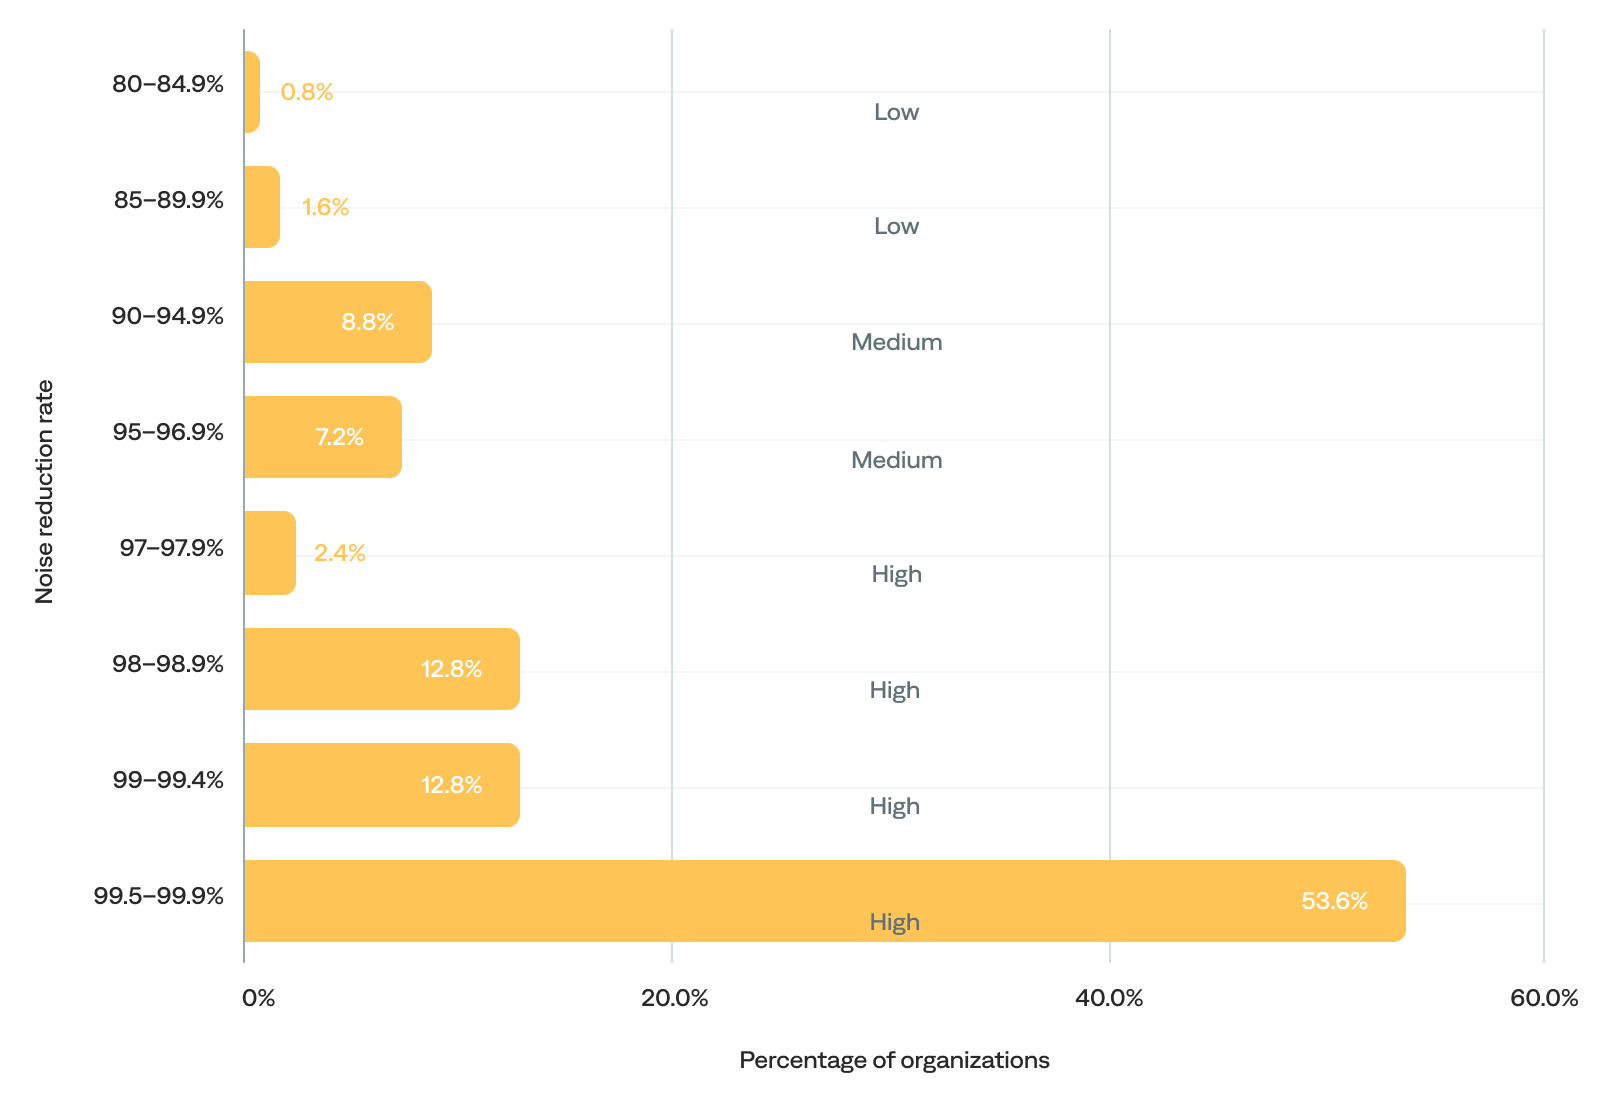
Noise reduction rate (event-to-actioned-incident) (n=125)
“BigPanda enabled us to implement AI that reduces alert noise and gets us to the root cause faster.”
–Divisional CTO, Managed Services Provider