-
Platform
-
-
Agentic ITOps Platform
 The BigPanda agentic ITOps platform is the next step in AIOps platforms. Using AI to automate IT from detection to resolution, improving operational efficiency.Explore the Platform
-
-
-
Solutions
-
-
Transform ITSM with Agentic ITOps
 Learn how enterprises can empower incident management teams with AI assistance by integrating agentic AI into their incident management strategy.Get the e-book
-
-
-
Resources
-
-
Derisking IT Change Management with Agentic AI
Discover why change risk management is no longer human-scale & which AI & automation features can prevent change-related incidents.Read the White Paper
-
-
-
Company
-
-
Careers
 We’re looking for talented, passionate, creative, and fun people to join our embarrassment of Pandas. (Yes, that’s really what a group of pandas is called!)Learn More
-
-


Events
An event is a point in time that represents the state of a service, application, or infrastructure component.
The pipeline process starts when BigPanda receives and ingests event data from monitoring and observability tools. These tools can generate events when potential problems are detected in the infrastructure.
This section reviews the volume of events, when events tend to occur, and event compression.
Key event highlights:
Event volume
BigPanda ingested nearly 6 billion events from inbound monitoring and change integrations.
When we remove the five outliers (fewer than 100,000 and 1 billion or more annual events), BigPanda ingested 4.5 billion events. The median annual events per organization was 9.6 million, and the median daily events per organization was 28,623.
- Half (50%) of the organizations generated at least 10 million events, including 17% that contributed 50 million or more events, representing 55% of the total annual event volume.
- Nearly three-quarters (72%) generated between 1 million and 50 million events, representing 20% of the total annual event volume.
- Typical or moderate-sized annual event counts ranged from 10 million to 50 million. A third (33%) of organizations fell in this medium volume range, representing 17% of the total annual event volume.
- Over a third (39%) generated a low-medium volume of annual events in the single-digit millions (at least 1 million but fewer than 10 million annual events), representing just 3% of the total yearly event volume.
- The remaining 11% had minimal volume (at least 100,000 but fewer than 1 million events per year), which may indicate that they were still onboarding.
of organizations sent 10M+ events per year to BigPanda
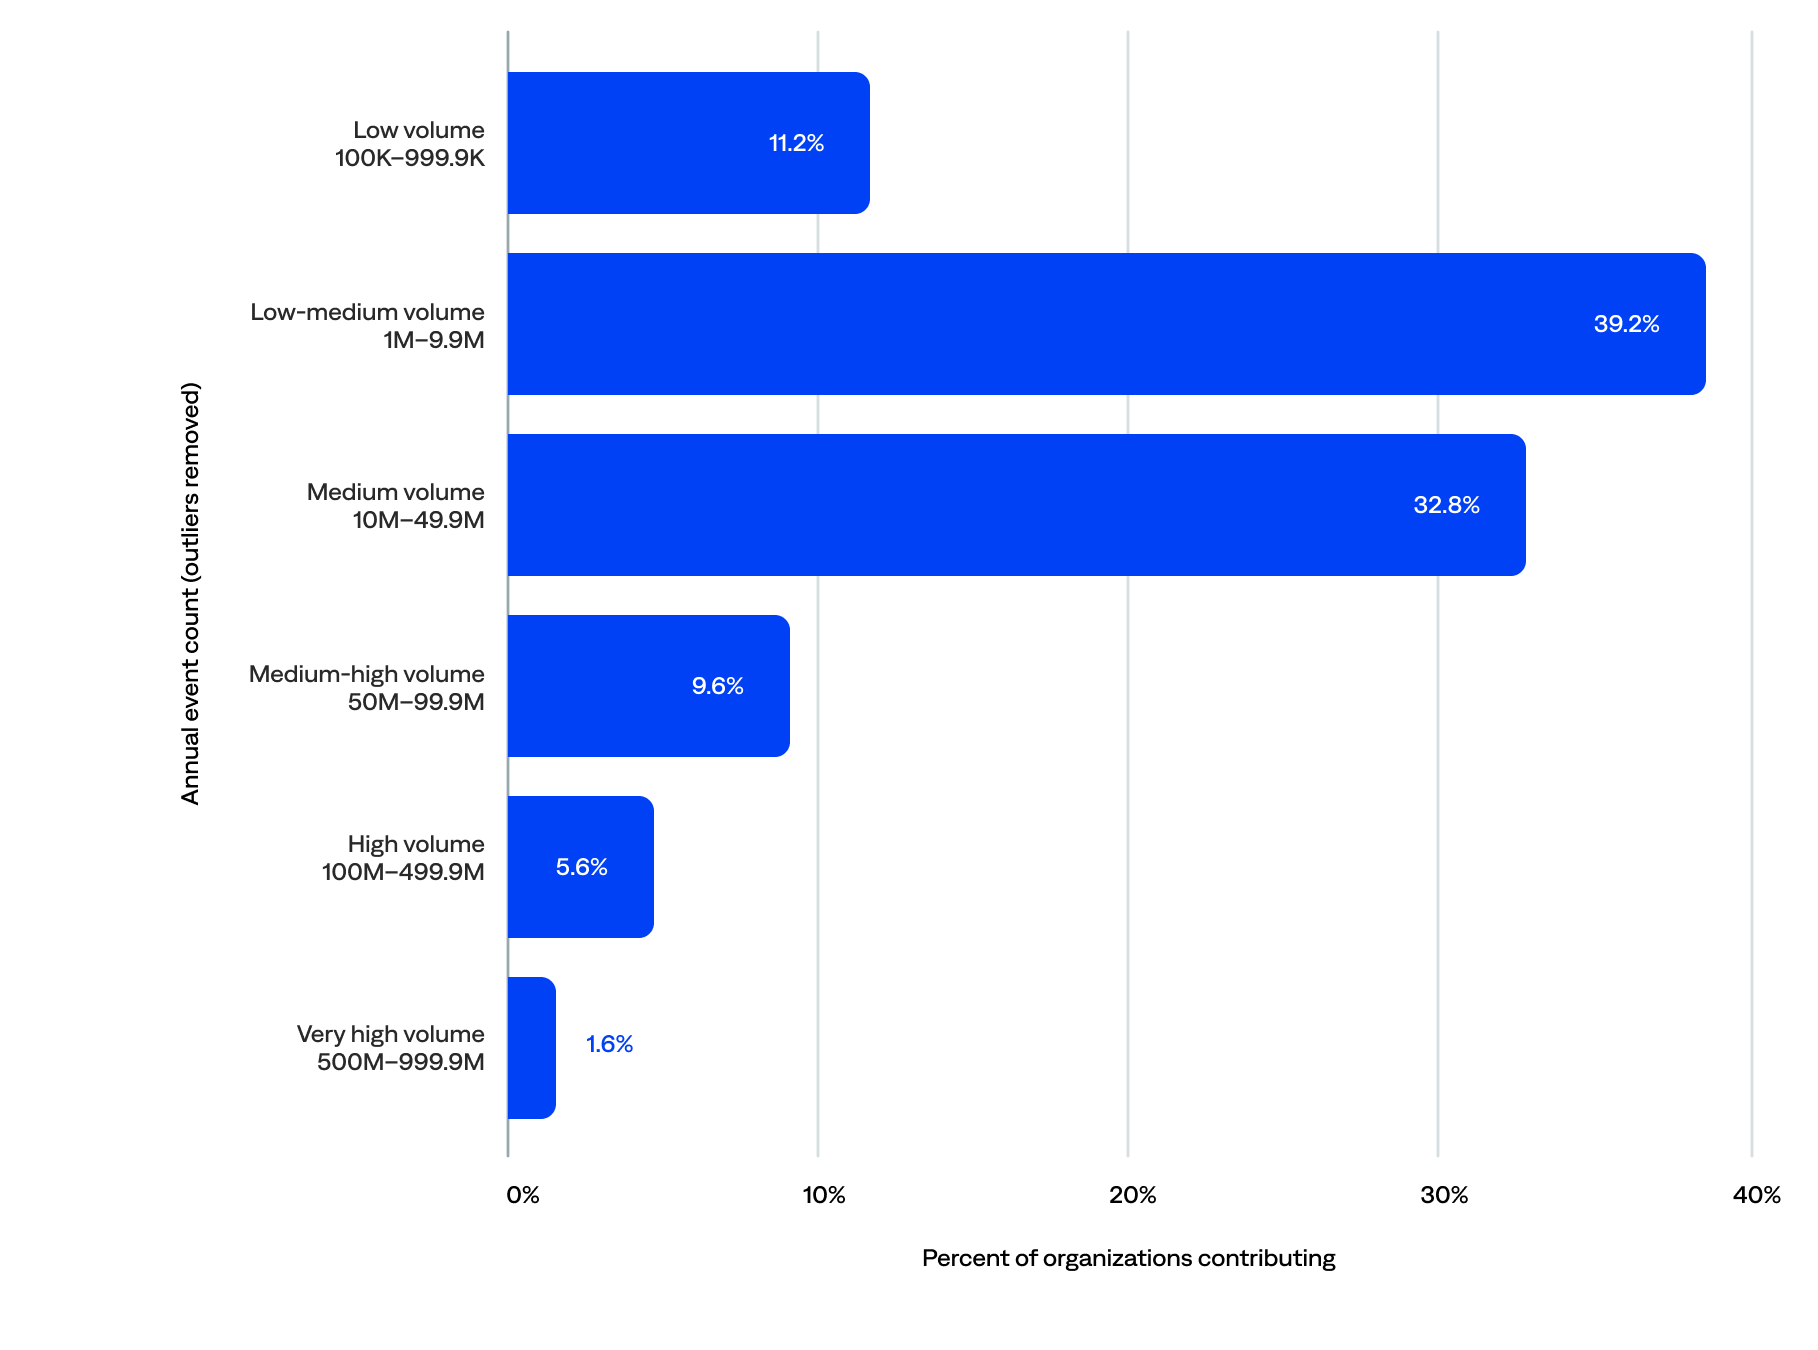
Annual event volume (n=125)
When events occur
This section reviews when events occur based on the UTC (Coordinated Universal Time, also known as Greenwich Mean Time or GMT) time zone.
By month of the year
The event count ranged from about 374.3 million to 540.2 million per month.
- The most events occurred in October (10.3%), followed by November (9.9%) and July (9.2%).
- The fewest events occurred in April (7.1%), followed by January (7.2%) and February (7.3%).
- When we compare by seasons, 29% happened in September, October, and November, 26% in June, July, and August, 23% in March, April, and May, and 22% in December, January, and February.
of events occurred in September, October, and November
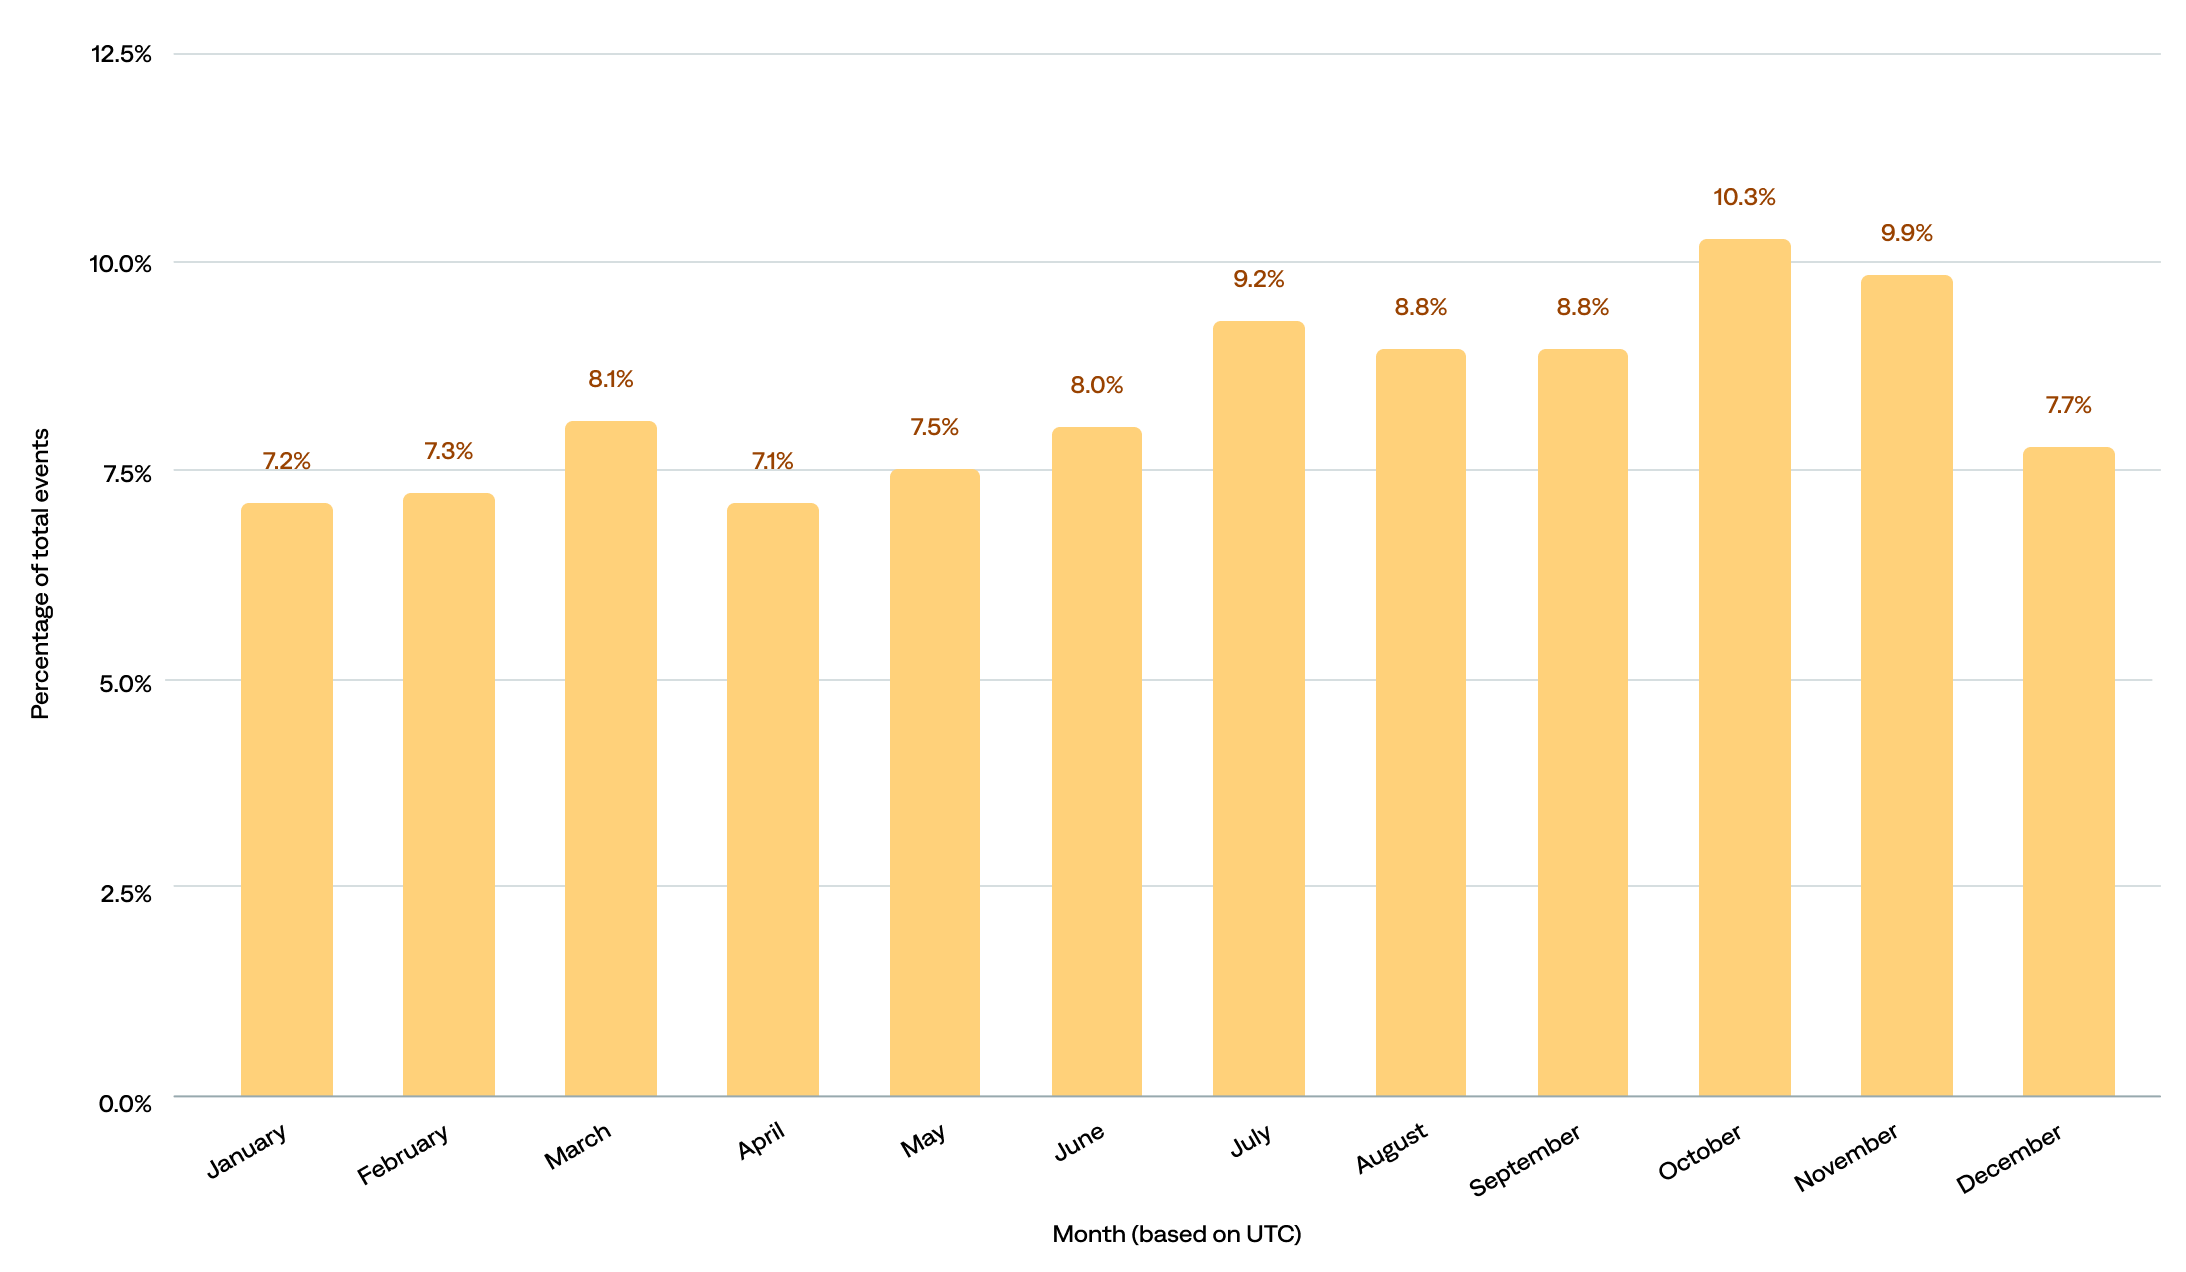
Percentage of total events by month in UTC (n=114)
By day of the week
As far as what day of the week events tend to happen, the data show that:
- Nearly three-quarters (73%) of events occurred on weekdays; Monday–Friday consistently saw higher activity, averaging over 767 million events per day.
- The peak event days were Wednesday, Thursday, and Friday, with 15% each or 45% total, compared to 14% each (28% total) for Monday and Tuesday.
- Weekends show a slight drop-off in events, with about 14% on Saturday and 13% on Sunday. However, 27% of events still occurred on weekends, which is bad news for those on call.
of events occurred on a weekend
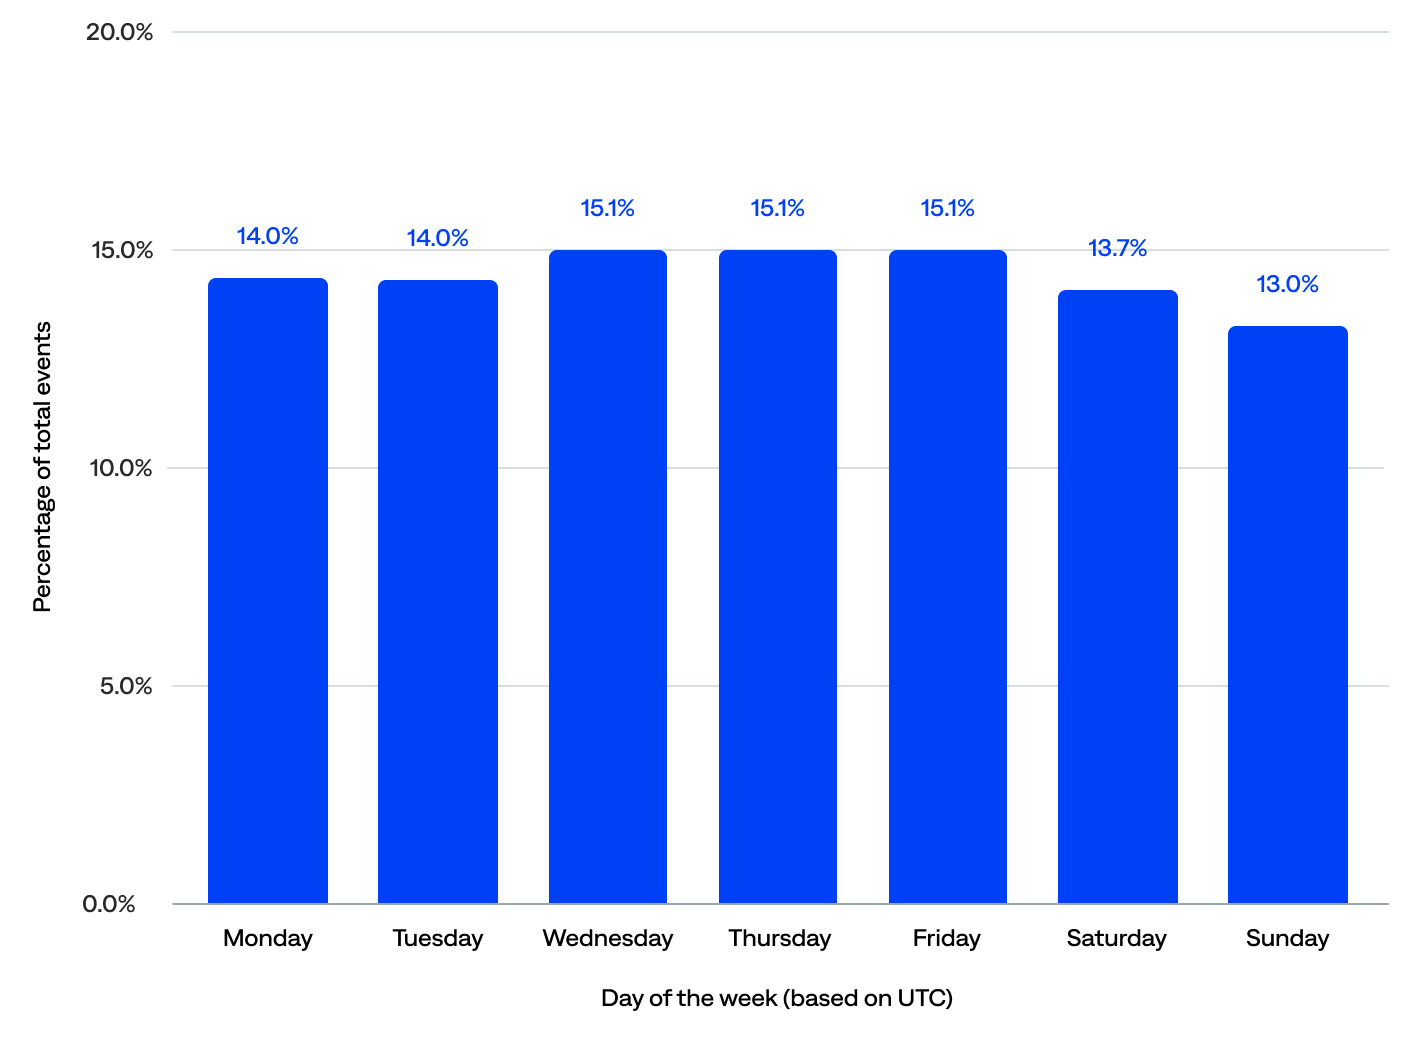
Percentage of total events by day of the week in UTC (n=114)
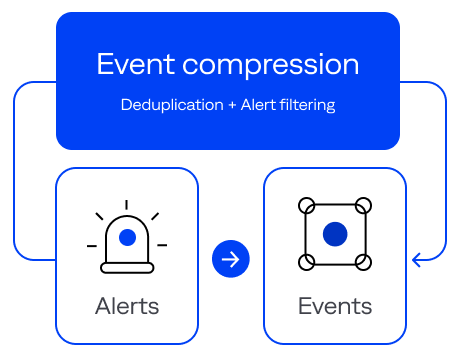
Event compression
Event compression is the number of events compressed into alerts. It consists of deduplication and alert filtering, which help prevent events from becoming alerts. Therefore, higher event compression rates correlate with less alert noise.
The median event compression rate was 87%.
Many organizations had achieved high compression, while others had room to improve (low and average compression):
- One in four (25%) had achieved high compression (95% or higher), suggesting strong use of deduplication and alert filtering. These organizations likely experienced less alert fatigue, a better signal-to-noise ratio, and lower support overhead.
- The majority (59%) fell into the average compression range (70–94%), which suggests they had taken steps to reduce noise but hadn’t fully optimized their setup.
- Only 17% were in the low compression range (<70%), likely due to early-stage adoption (still onboarding) or poor use of deduplication and alert filtering. They may have experienced high alert noise, a poor signal-to-noise ratio, or incomplete configurations.
of organizations achieved a high event compression rate (95+%)
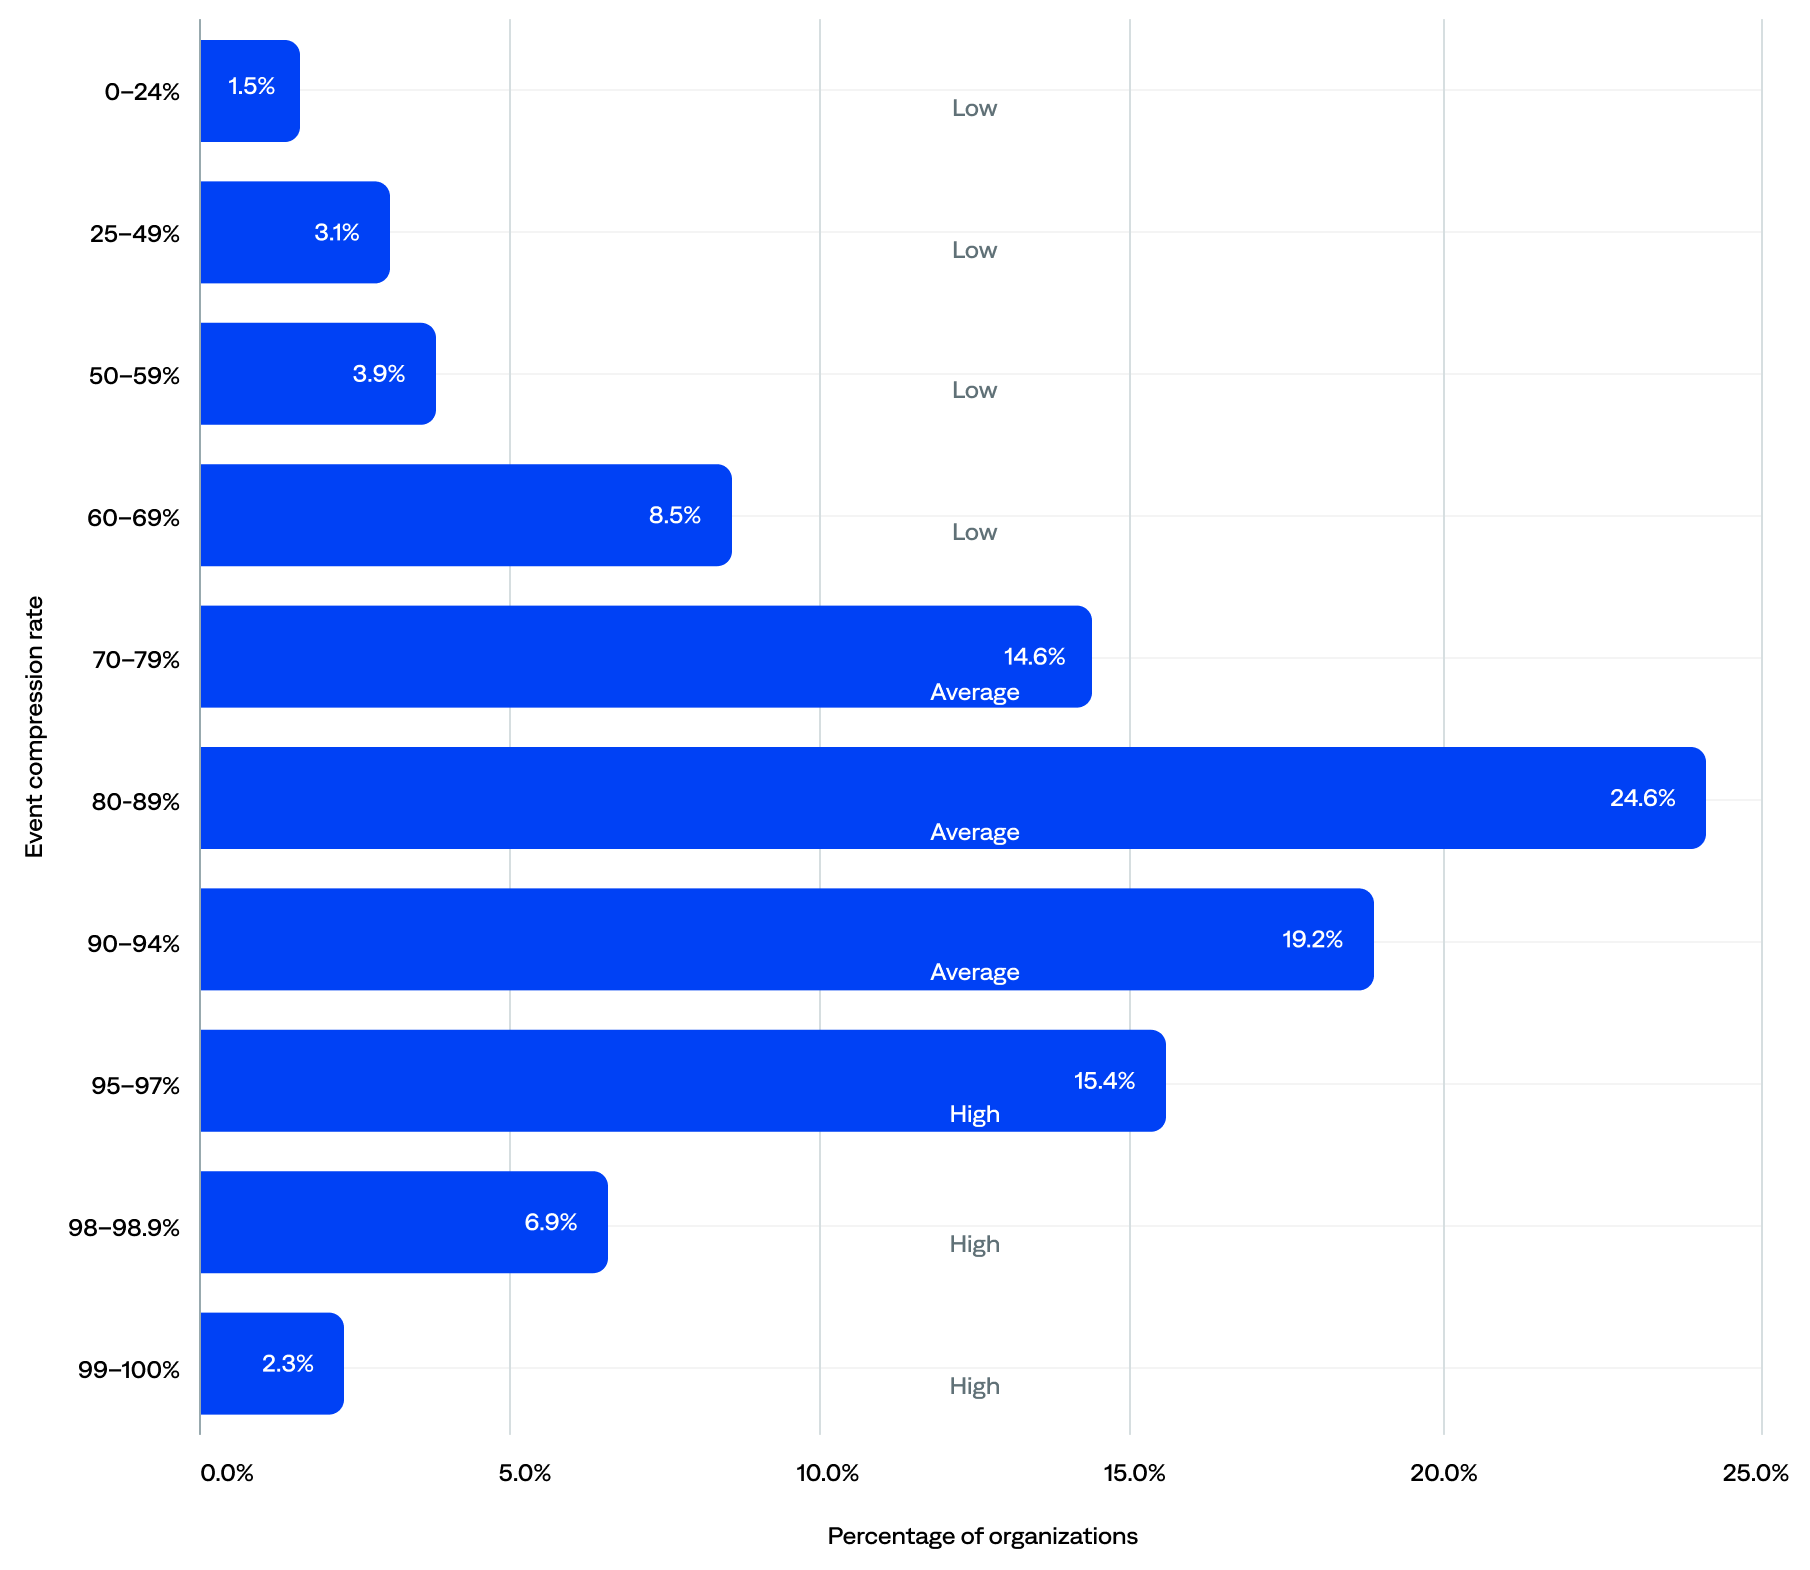
Event compression rate range and tier by organization (n=125)
Deduplication
Also known as event deduplication, deduping is the process by which BigPanda eliminates redundant data to reduce noise and simplify incident investigation. Deduplicated events are events that were removed as precise duplicates.
BigPanda has a built-in deduplication process that reduces noise by intelligently parsing incoming raw events. It groups events into alerts based on matching properties. Exact duplicate matches add clutter to the system and are not actionable. BigPanda discards precise duplicates of existing events immediately. However, it merges updates to existing alerts rather than creating a brand-new alert.
The median deduplication rate was 93.6%.
- Most (63%) organizations had deduplication rates of 90% or more, including 42% with rates of 95% or more, and 18% clustering around the 99% mark—enabling them to focus only on incidents that matter.
- The remaining 37% had deduplication rates of less than 90%, likely due to subpar configuration, purposely choosing not to deduplicate, or poor quality data that’s difficult to dedupe well.
- Just 10% of the total events were deduplicated into alerts. In other words, in 2024, BigPanda helped prevent 90% of noisy alerts (event deduplication rate). Put another way, on average, BigPanda helped prevent over 43 million alerts per organization per year.
of organizations benefited from 90+% event deduplication

Deduplication rate per organization
Alert filtering
In the context of BigPanda, alert filtering is a feature that allows users to filter out or suppress specific alerts. Filtered-out events are unactionable events that were filtered out using alert filters.
Filtering alerts helps ITOps teams stop duplicate, low-relevance events from being correlated into incidents. Stopping alert noise before it reaches the incident feed enables teams to focus on the most important incidents and spend their time and effort on the most critical issues.
Alert filtering affects alerts after they have been normalized and enriched. The added context of the enrichment process enables teams to filter events based on alert metadata and enrichment tags.
Over half (55%) of organizations had configured at least one alert filter in BigPanda. The remaining 45% likely configured alert filters upstream before they reach BigPanda.
Excluding organizations with no alert filters, the median alert filters per organization was two. Of those organizations that had configured alert filters:
- Over two-thirds (67%) configured 1–5.
- Nearly a quarter (22%) configured 6–24.
- About one in ten (11%) configured 25 or more.
of organizations configured at least one alert filter in BigPanda
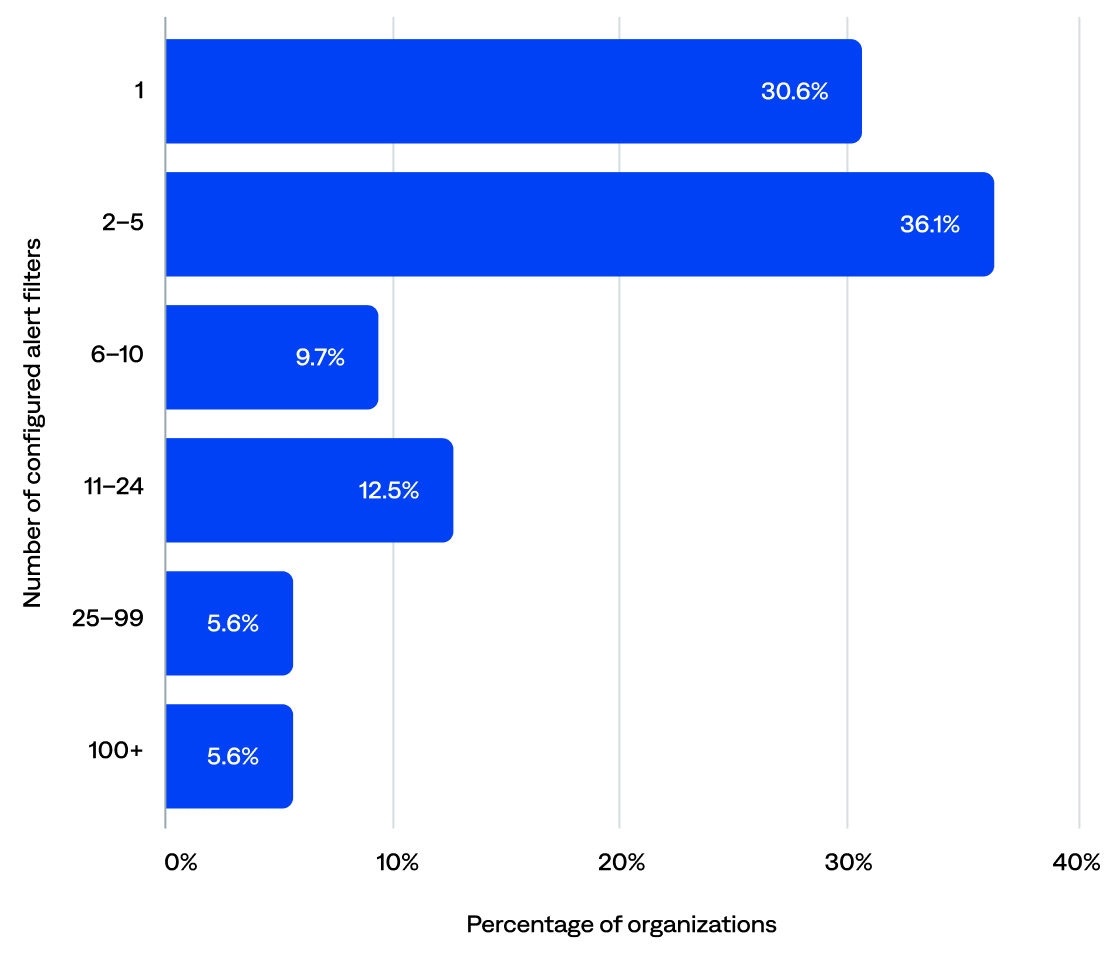
Number of configured alert filters per organization (n=72)

- PlatformPlatform
- Agentic IT Operations
- Platform Overview
- AI Detection & Response
- AI Incident Assistant
- AI Incident Prevention
- IT Knowledge Graph
- BigPanda AIOps
- BigPanda Core
- Advanced Insight
- Biggy AI
- Rebranding Matrix
- Integrations
- Security & Compliance
- Features
- Detection
- Open Integration Hub
- AI Detection
- Diagnosis
- Service Desk Correlation
- Suggested Actions
- Incident Correlation
- Triage
- Automated Incident Triage
- Root Cause Analysis
- Similar Incidents
- Prevention
- Change Risk Management
- Problem Management
- Solutions
- Automating L1 Detection & Response
- Empowering Experts with AI Assistance
- Predicting & Preventing Disruptions
- Personas
- IT operations
- Incident management
- IT service management
- Site Reliability Engineering
- Industries
- Financial services
- Manufacturing
- Insurance
- Media and entertainment
- Managed services
- All industries