


What is observability?


Modern IT environments are complex and interconnected. The challenge is not just ensuring systems run smoothly. IT teams need a complete picture of the complicated web of data, services, and user interactions that drive your operations.
This is where observability comes into play. Observability offers a deeper understanding of why issues arise in the first place. It allows you to trace service requests, pinpoint bottlenecks, and identify the root cause of incidents.
As IT teams are expected to manage increasingly complex and fragmented IT infrastructures, the need for instrumentation that monitors those systems is simultaneously growing. Observability owners are expected to have end-to-end visibility across every layer of their applications, services, and infrastructure.
Effective observability helps move your organization from a reactive stance—waiting for issues to pop up—to a proactive approach, where you anticipate and resolve potential problems before they impact your system’s performance.
This article explores how observability provides a critical foundation for effective IT incident management.
What is observability?
Observability is the practice of assessing a system’s internal state by analyzing the data it produces, specifically metrics, logs, and traces. As cloud-native environments become more complex, observability helps quickly find and fix the root cause of failures, optimize cloud infrastructure management, and prevent issues from affecting users.
For IT operations teams, effective observability means seeing what’s happening inside your systems, making it easier to keep everything running smoothly and reliably.
Metrics, logs, and traces: The three pillars of observability
Understanding observability starts with recognizing its core components, often referred to as the key pillars. Each pillar—metrics, logs, and traces—serves a unique purpose, working together to provide a full picture of IT system behavior and performance.
Here’s a closer look.
Metrics
Metrics are the numerical data points showing how a system performs over time. Collected regularly, they measure CPU usage, memory consumption, request rates, and error rates. Analyzing the data can help uncover trends and patterns, making it easier to monitor a system’s health, set alerts, and spot any unusual activity.
Logs
Logs are records of events that happen within a system. They capture everything from routine operations to errors and warnings, providing a detailed account of what’s happening.
Whenever an issue arises, you can review logs to trace the sequence of events that led to it. This process allows you to understand what went wrong, making diagnosing and resolving problems easier. Plus, you gain actionable insights into recurring issues and can take steps to prevent them in the future.
Traces
Traces follow the path of a request as it moves through different services and components in the system. In cloud environments with many interconnected services, traces help you see the entire journey of a transaction. They are important for identifying where delays or failures occur so you can optimize performance across the system. You get a detailed view, which helps you ensure everything is running efficiently and enhances the user experience.
Observability vs. monitoring: Key differences for incident management
Monitoring involves regularly collecting and analyzing predefined metrics and logs from your systems. It’s a reactive process designed to alert you when something goes wrong, such as when a server goes down or a threshold is breached. Monitoring tools offer a snapshot of your system’s health, notifying your team of specific issues that need immediate attention.
In contrast, observability goes beyond monitoring, providing deeper insights by integrating metrics, logs, and traces. It enables a comprehensive understanding of system health and behavior, allowing for more effective incident management.
Here’s a quick rundown of the main differences between observability and monitoring in incident management.
- Proactive vs. reactive: Monitoring notifies you of issues based on predefined metrics, making it a reactive tool. Observability allows for a more proactive approach by offering comprehensive data analysis that helps you foresee and address issues before they become critical.
- Depth of insight: Monitoring provides visibility into specific areas of the system that you’ve set up to track. Observability offers a more extensive and detailed view, enabling you to understand the system’s condition and behavior.
- Root cause identification: When an incident occurs, monitoring alerts you that something is amiss, while observability helps you uncover the underlying cause. This capability is essential for resolving incidents efficiently and accurately.
- Adaptability: As IT environments evolve and new challenges arise, observability’s flexibility helps you analyze and address unfamiliar issues. Compared to traditional monitoring methods, this adaptability provides a significant advantage in maintaining system stability and reliability.
The role of observability in incident management
In incident management, observability is the backbone powering artificial intelligence for IT Operations (AIOps). AIOps uses AI and machine learning to automate and enhance the detection, diagnosis, and resolution of incidents in IT systems.
So what’s the catch? AIOps relies heavily on the quality and depth of data it processes to be effective—and this is where observability becomes crucial.
Observability provides the rich, contextual data that AIOps systems need to operate efficiently. By capturing and analyzing metrics, logs, and traces, it offers a multidimensional view of system performance and behavior. This detailed data allows AIOps to detect anomalies faster and better understand interactions between different system components.
Consequently, AIOps can make more accurate predictions and automate responses to potential issues before they escalate.
Moreover, observability enhances the learning capabilities of AIOps by continuously supplying real-time insights, enabling the AI to refine and improve its algorithms over time. This synergy ensures that incident management processes evolve from being merely reactive to becoming increasingly proactive, where IT teams can maintain system health more effectively.
Key benefits of observability for incident management
Observability offers the following benefits that significantly enhance incident management in IT environments:
Improved incident response
Observability frameworks take incident response to the next level by monitoring data from every part of cloud infrastructure, including microservices, databases, and networks.
When something unusual happens—like a sudden spike in latency or a service outage—observability platforms immediately flag it. Your IT team can respond in real time and tackle the issue before it escalates. For example, if a critical service begins to degrade, observability can trigger alerts that guide the team directly to the problem’s source, enabling them to implement a fix faster.
Accelerated root cause analysis
Finding the root cause of an incident in a complex IT setup can be like finding a needle in a haystack. Observability makes this easier by connecting the dots across different system layers.
Let’s say a database query slows down. Observability tools can track the issue through application logs, network metrics, and server data to determine whether it’s a service glitch, a network bottleneck, or something else. By giving you a full picture, observability helps ensure that you’re not just putting a band-aid on the problem but fixing it at the source for a more permanent solution.
Proactive management through predictive analysis
Observability extends beyond reactive measures; it enables proactive management through predictive analysis.
By analyzing historical data and real-time metrics, observability systems can spot patterns and predict potential problems before they happen. For example, if a microservice steadily uses more memory, observability can forecast when it might run out and cause an error. With this insight, IT teams can take proactive action—like optimizing the service or scaling resources—before the problem ever occurs.
Best practices for implementing observability in your organization
- Set clear objectives and KPIs: Before diving into observability, you need a clear game plan. What do you want to achieve? Whether it’s reducing downtime, improving root cause analysis, or boosting system reliability, setting specific objectives shapes your observability approach. Defining KPIs along the way also means you can track progress and align your observability efforts with organizational goals.
- Ensure comprehensive data collection across the stack: Start by identifying observability data sources and collecting data from every infrastructure layer. This data collection includes logs, metrics, and traces from all the critical components—cloud-native applications, databases, networks, and microservices. This will help you better understand the system’s behavior, simplifying anomaly identification and troubleshooting. Plus, pulling all the data into a single platform means you can correlate and analyze it more effectively.
- Prioritize granular and contextualized monitoring: This means closely monitoring specific components, services, and dependencies to catch performance issues before they become bigger problems. Context is key here, too: by correlating data across different services and understanding how they interact, you get deeper insights that help you accurately pinpoint the root cause of issues.
- Leverage automation and AIOps integration: Integrating observability with AIOps takes observability a step further. AIOps can sift through massive datasets to spot patterns and predict potential issues, allowing you to manage incident workflows proactively.
- Foster collaboration and continuous improvement: When development, operations, and IT teams work together, they can more effectively apply insights from observability to improve system performance. Regular cross-team discussions align everyone on incident management strategies and can drive continuous improvement. Continuously updating observability solutions and practices based on feedback ensures they remain effective and responsive to changing needs.
Agentic ITOps can enhance the value of observability tools
Observability tools lay the groundwork for effective incident management. However, without context, correlation, and enrichment, the signal gets lost. Even the most effective observability tools have room for improvement. While observability tools provide system visibility by collecting metrics, events, logs, and traces, they create a massive volume of noise, making it difficult for your teams to take action.
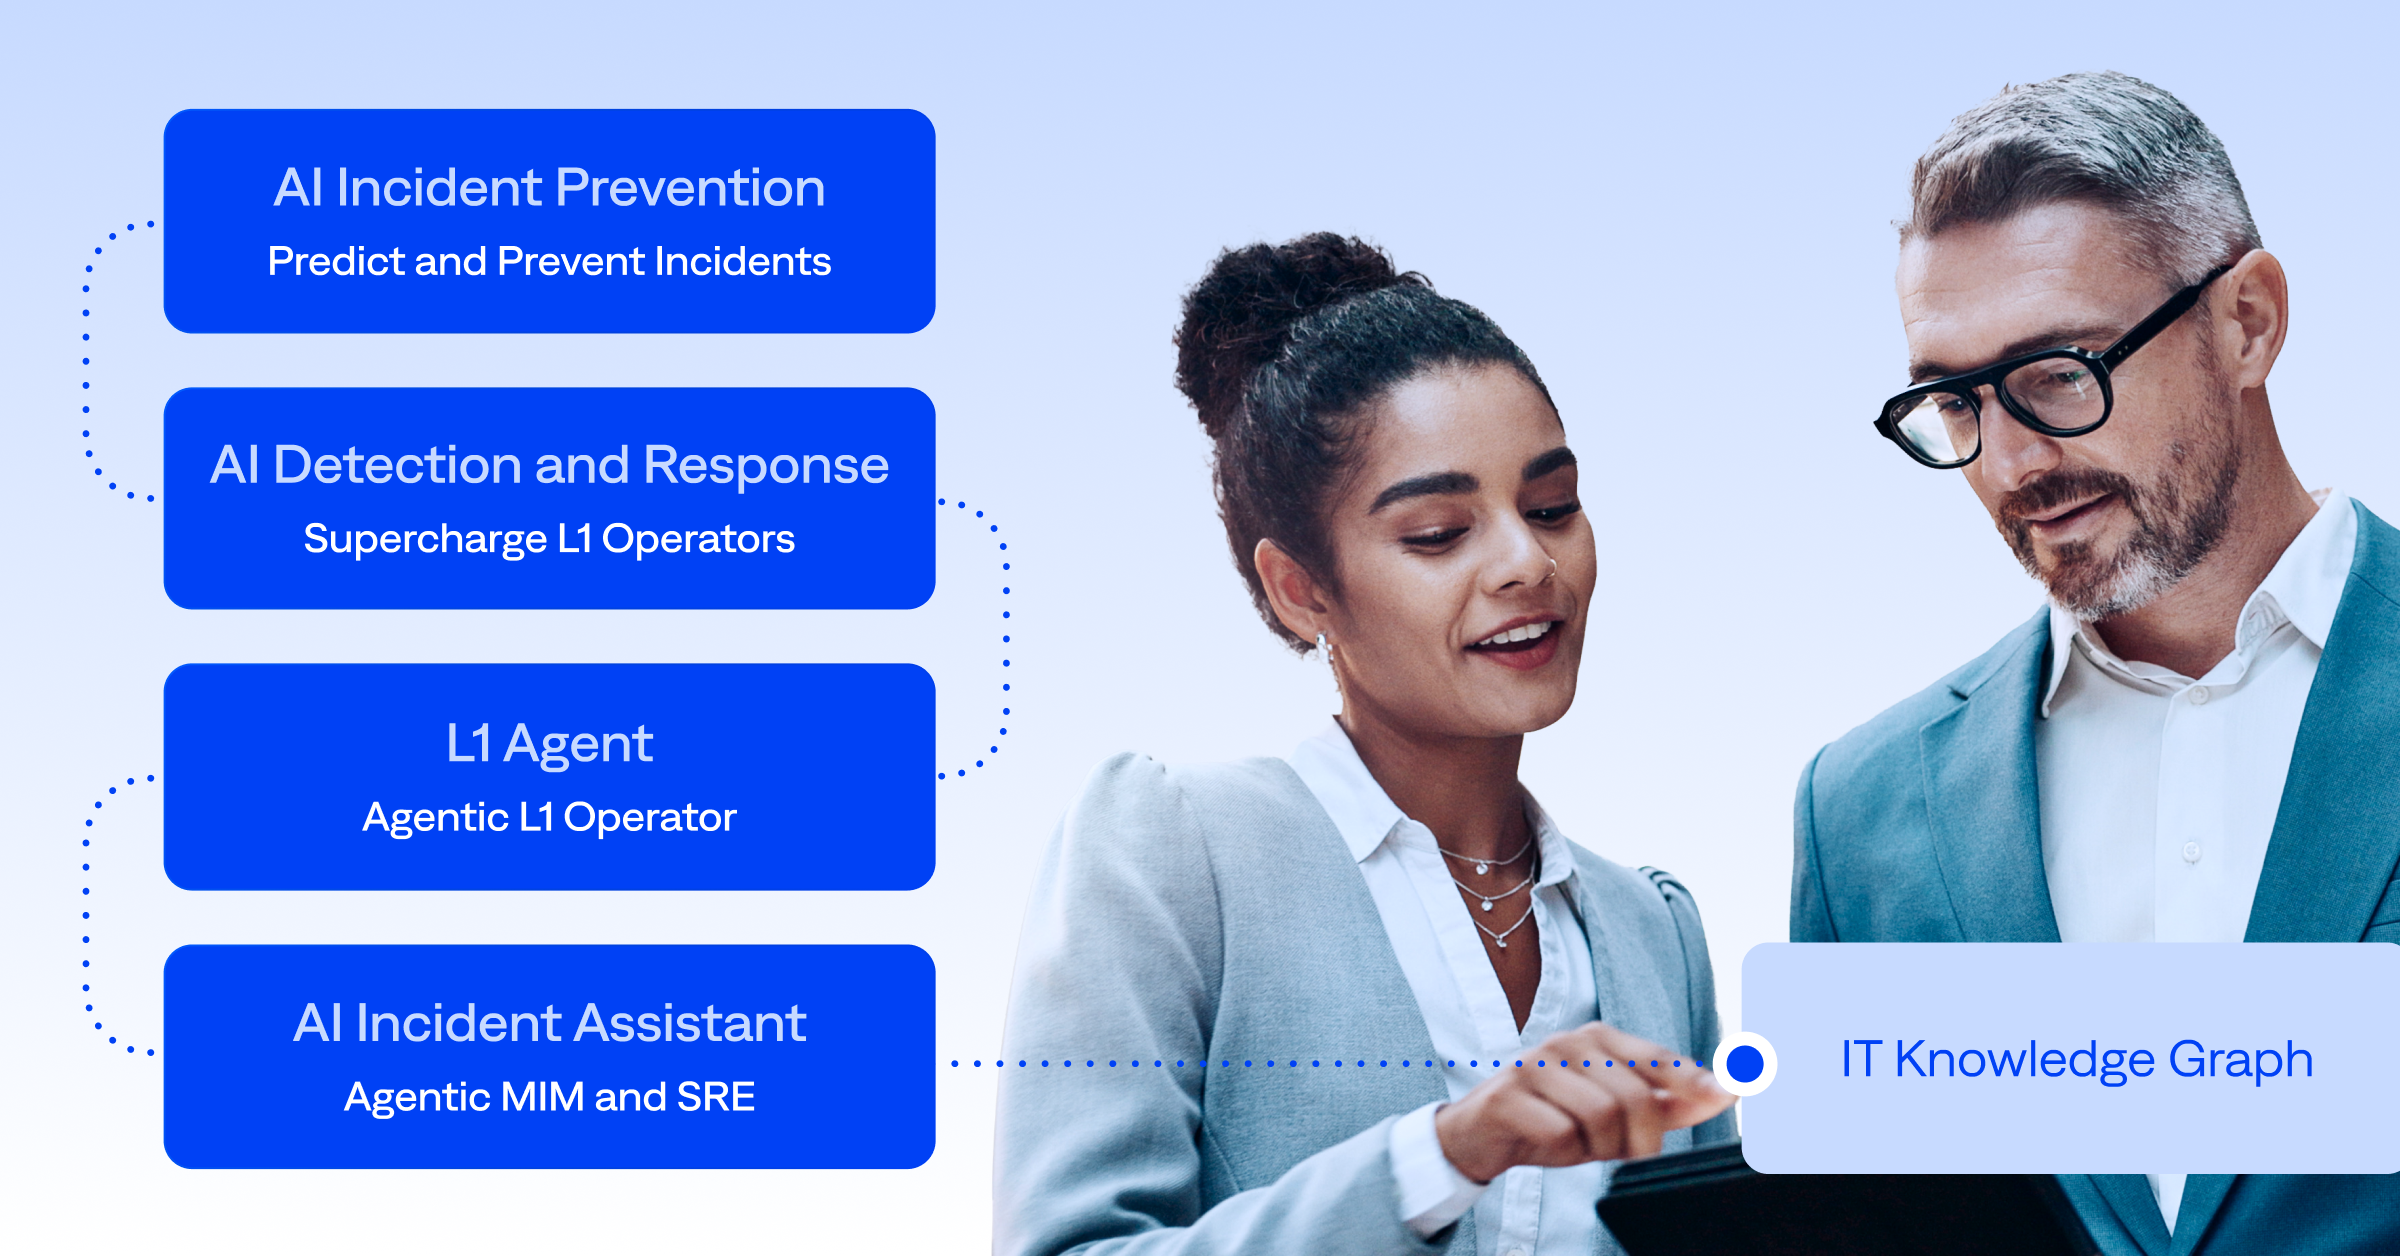
Agentic AI-powered ITOps can enhance your observability strategy and help overcome these limitations. Agentic ITOps maximize the value of your observability investments by automatically filtering out unnecessary noise and highlighting critical, actionable alerts. The BigPanda agentic IT operations platform ingests alert data from observability and monitoring tools, normalizes it, and enriches it with operational, contextual, and topology data from available CMDBs. Our platform delivers accurate, up-to-date, real-time visibility into your applications, services, and infrastructure while reducing noise, correlating multi-source alerts, and enabling powerful workflow automations.
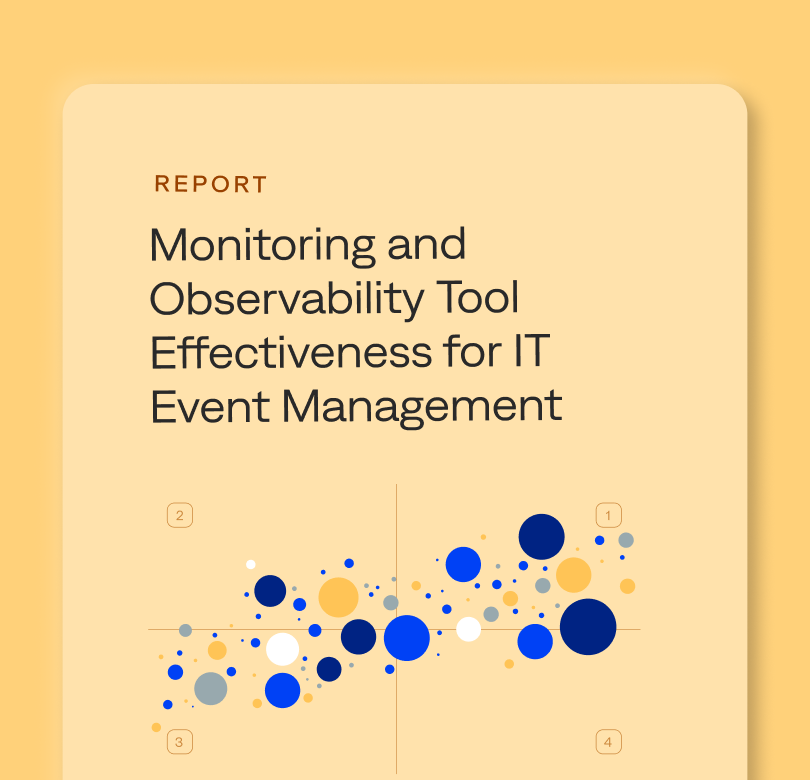
BigPanda recently released our first-ever research report based on data gathered from our agentic IT operations platform. Our Monitoring and Observability Tool Effectiveness for IT Event Management report provides insights and benchmarks on incident detection and noise reduction for 130 enterprise organizations, including the monitoring and observability data sources integrated with BigPanda.