


Introducing the BigPanda observability tool rationalization framework

Enterprises face spiraling observability costs. Gartner reports a 20% year-over-year rise in spending, with the median spend per observability tool reaching $800,000 annually. The average organization using BigPanda coordinates data from ~20 different observability solutions, each taking up an ever-larger portion of IT budgets.
This proliferation of observability and monitoring tools is also known as tool sprawl, and our customers report that managing these tools is a constant challenge. The instinctive response is to conduct tool rationalization to reduce licenses, overlap, and costs. Tool rationalization, sometimes called tool consolidation, is the systematic analysis of observability and monitoring tools, the consideration of onboarding new tools to fill gaps, and the retirement of unnecessary tools.
But here’s the catch: most rationalization efforts are conducted solely within observability teams, which neglects how monitoring aids in proactive detection, incident response, and overall service availability. Without a framework to evaluate performance across all of IT, and not just with the observability tool owner, teams are left guessing what to keep, optimize, or retire.
Observability sprawl: Why observability and monitoring tool rationalization is so difficult
Monitoring and observability tools weren’t built with rationalization in mind. Each started with a focused purpose, such as application tracing, network health, or infrastructure visibility, and expanded over time into overlapping territory. That makes it hard to objectively compare these tools.
To make the situation even more challenging, the value of a given tool often depends on who you ask. Developers may praise an application performance monitoring (APM) tool for its deep code insights, while IT operations experience little to no contribution to detecting early warnings or active incidents. Meanwhile, finance sees increasing licensing costs each year.
The result? Decisions that are subjective, fragmented, and rarely tied to the outcomes that matter most to IT, such as improved incident response efficiency, service availability, and customer trust. In fact, based on our analysis of 130 enterprise organizations using the BigPanda platform, the average enterprise sends 9.6 million observability events annually to BigPanda. However, fewer than 1 in 5 (18%) of these are actionable.
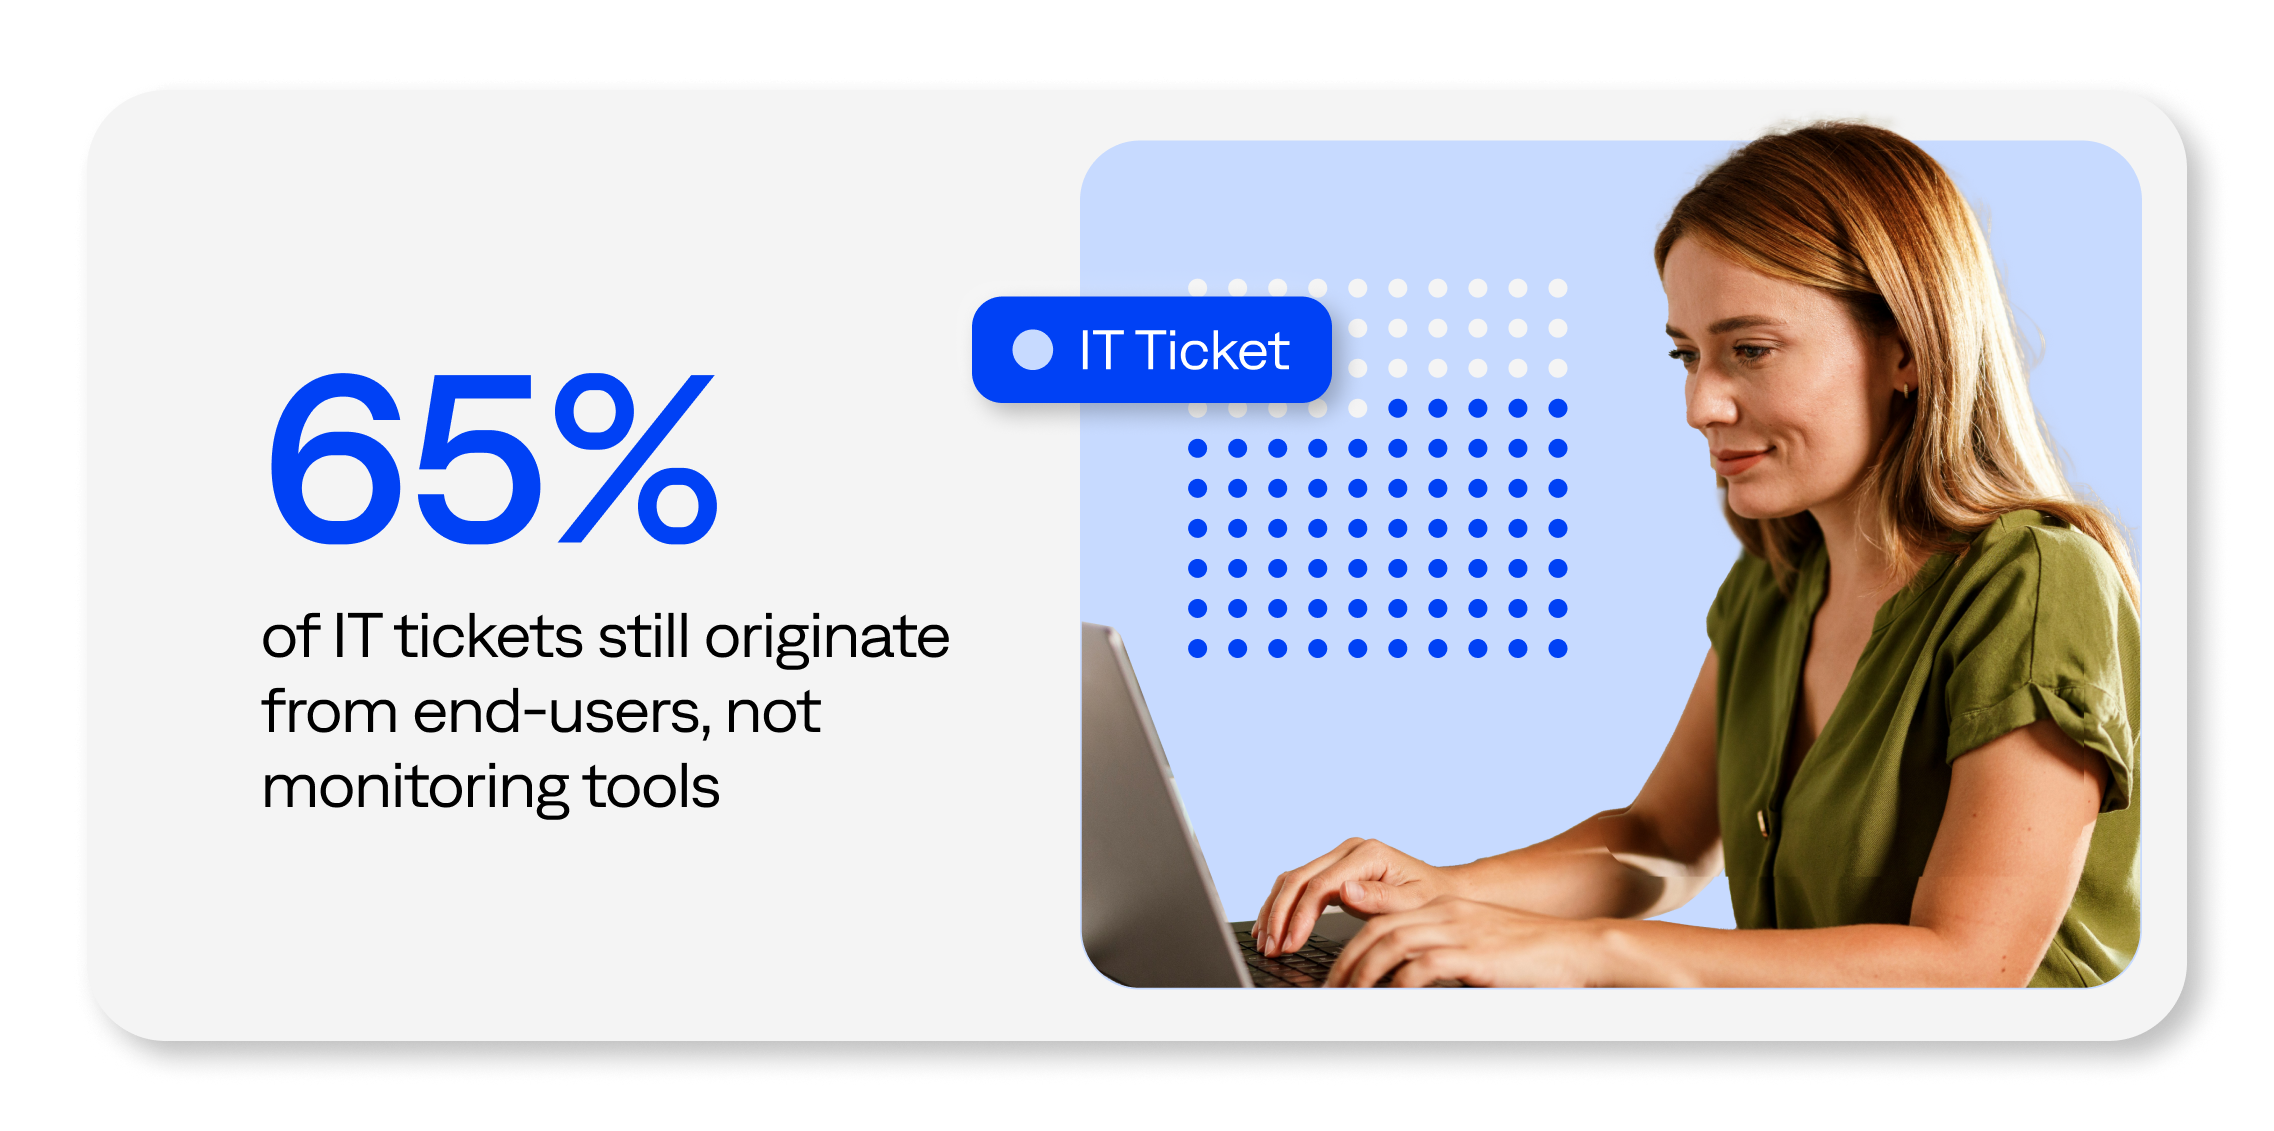
In short, enterprises are paying for visibility that rarely translates into business outcomes. Despite the surge in observability investments over the years, 65% of IT tickets still originate from end-users, not monitoring tools.
Tool rationalization takes time and coordination across the organization. When discussing tool consolidation, IT leaders are constantly balancing whether to consolidate tools to reduce costs and streamline processes, or invest in more tools to push toward innovation. As a result, the topic of tool rationalization presents IT leaders with a fine line to walk.
The BigPanda observability and monitoring tool rationalization framework
We recently hosted a webinar that illustrated how enterprises can implement a data-driven framework to evaluate observability and monitoring tools.
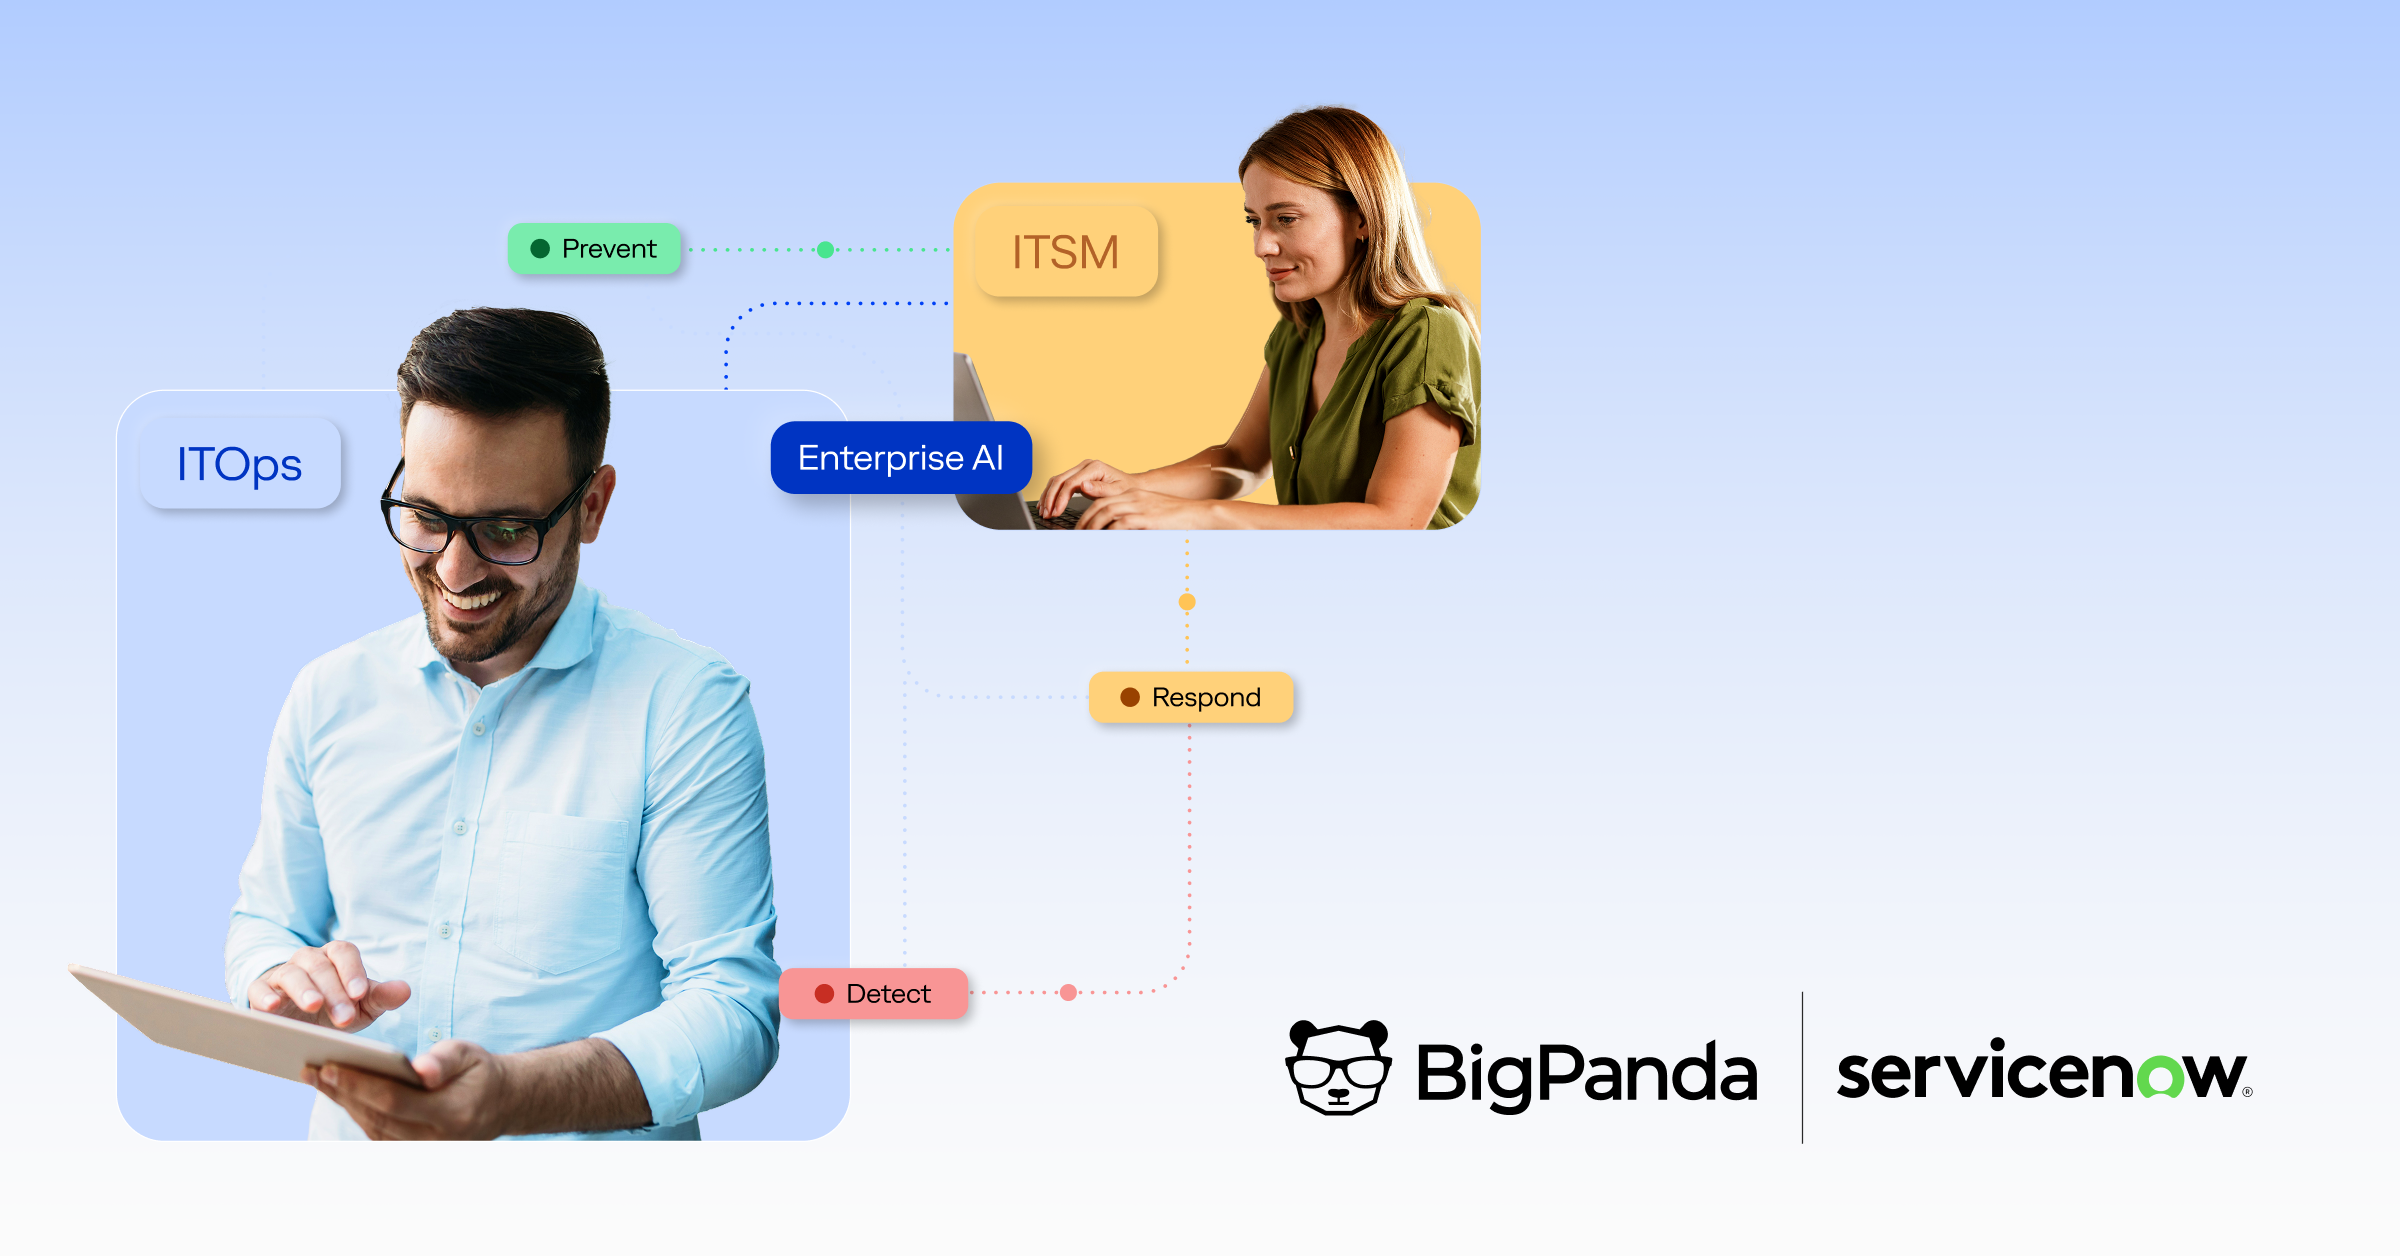
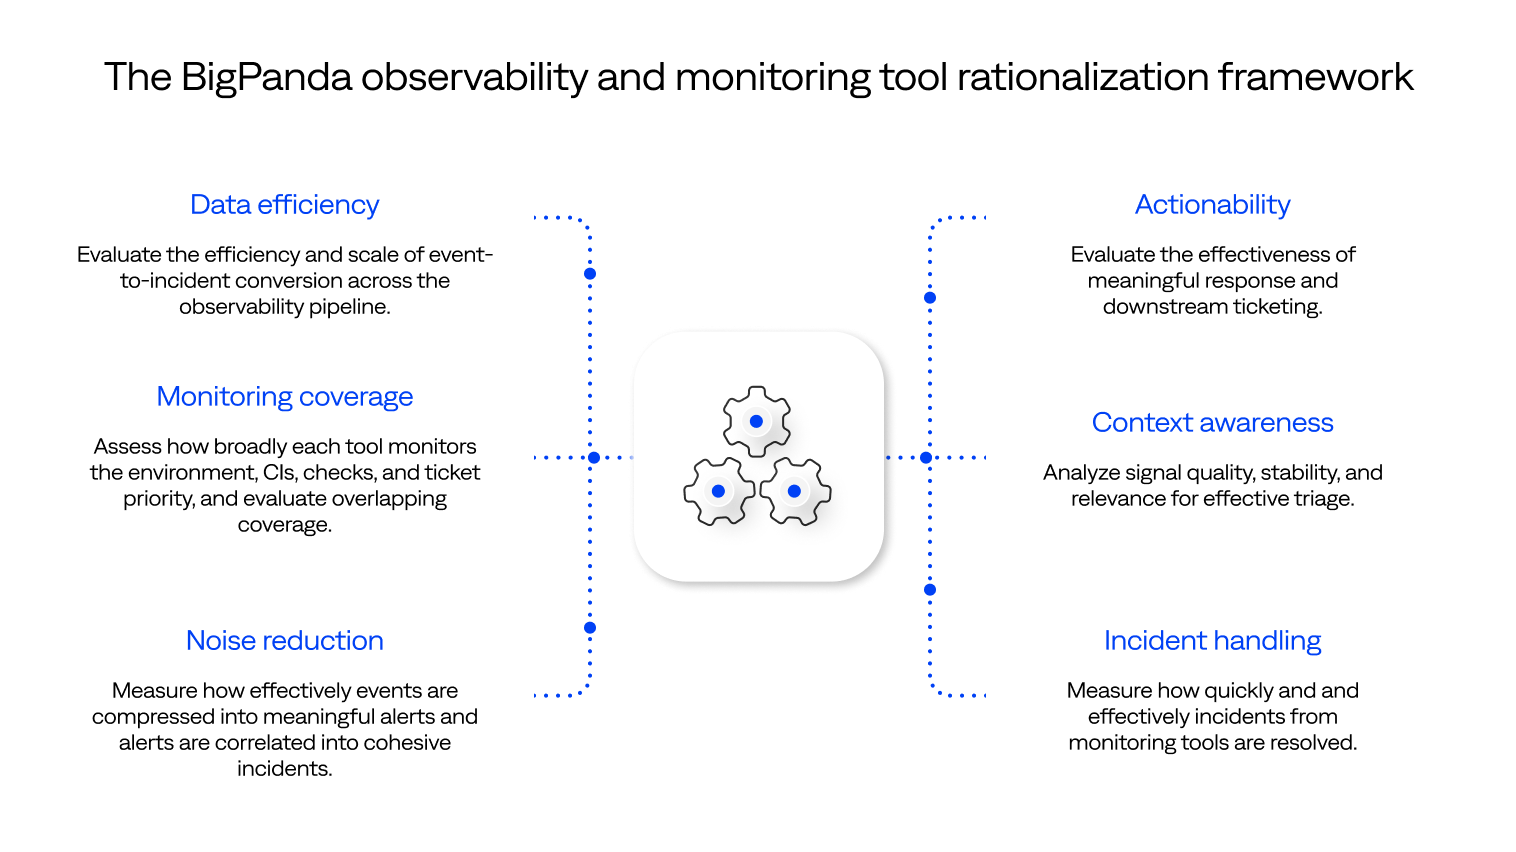
This framework is based on various factors that will help IT leaders understand their contribution and value towards improving ITOps and ITSM outcomes.
- Make sure the framework spans the entire incident lifecycle, from detection through resolution.
- Go beyond single KPIs with multi-dimensional metrics that tell the whole story.
- Benchmark performance against industry standards to highlight where you’re leading or lagging.
The result is a data-driven picture of which tools deliver value, which can be optimized, and which are ready to retire.
Benchmarking observability and monitoring tools across these dimensions using scorecards, heat maps, and baselines gives enterprises a shared language across observability, ITOps, and ITSM. Rationalization decisions stop being about personal preference and start being about creating real value for your organization.
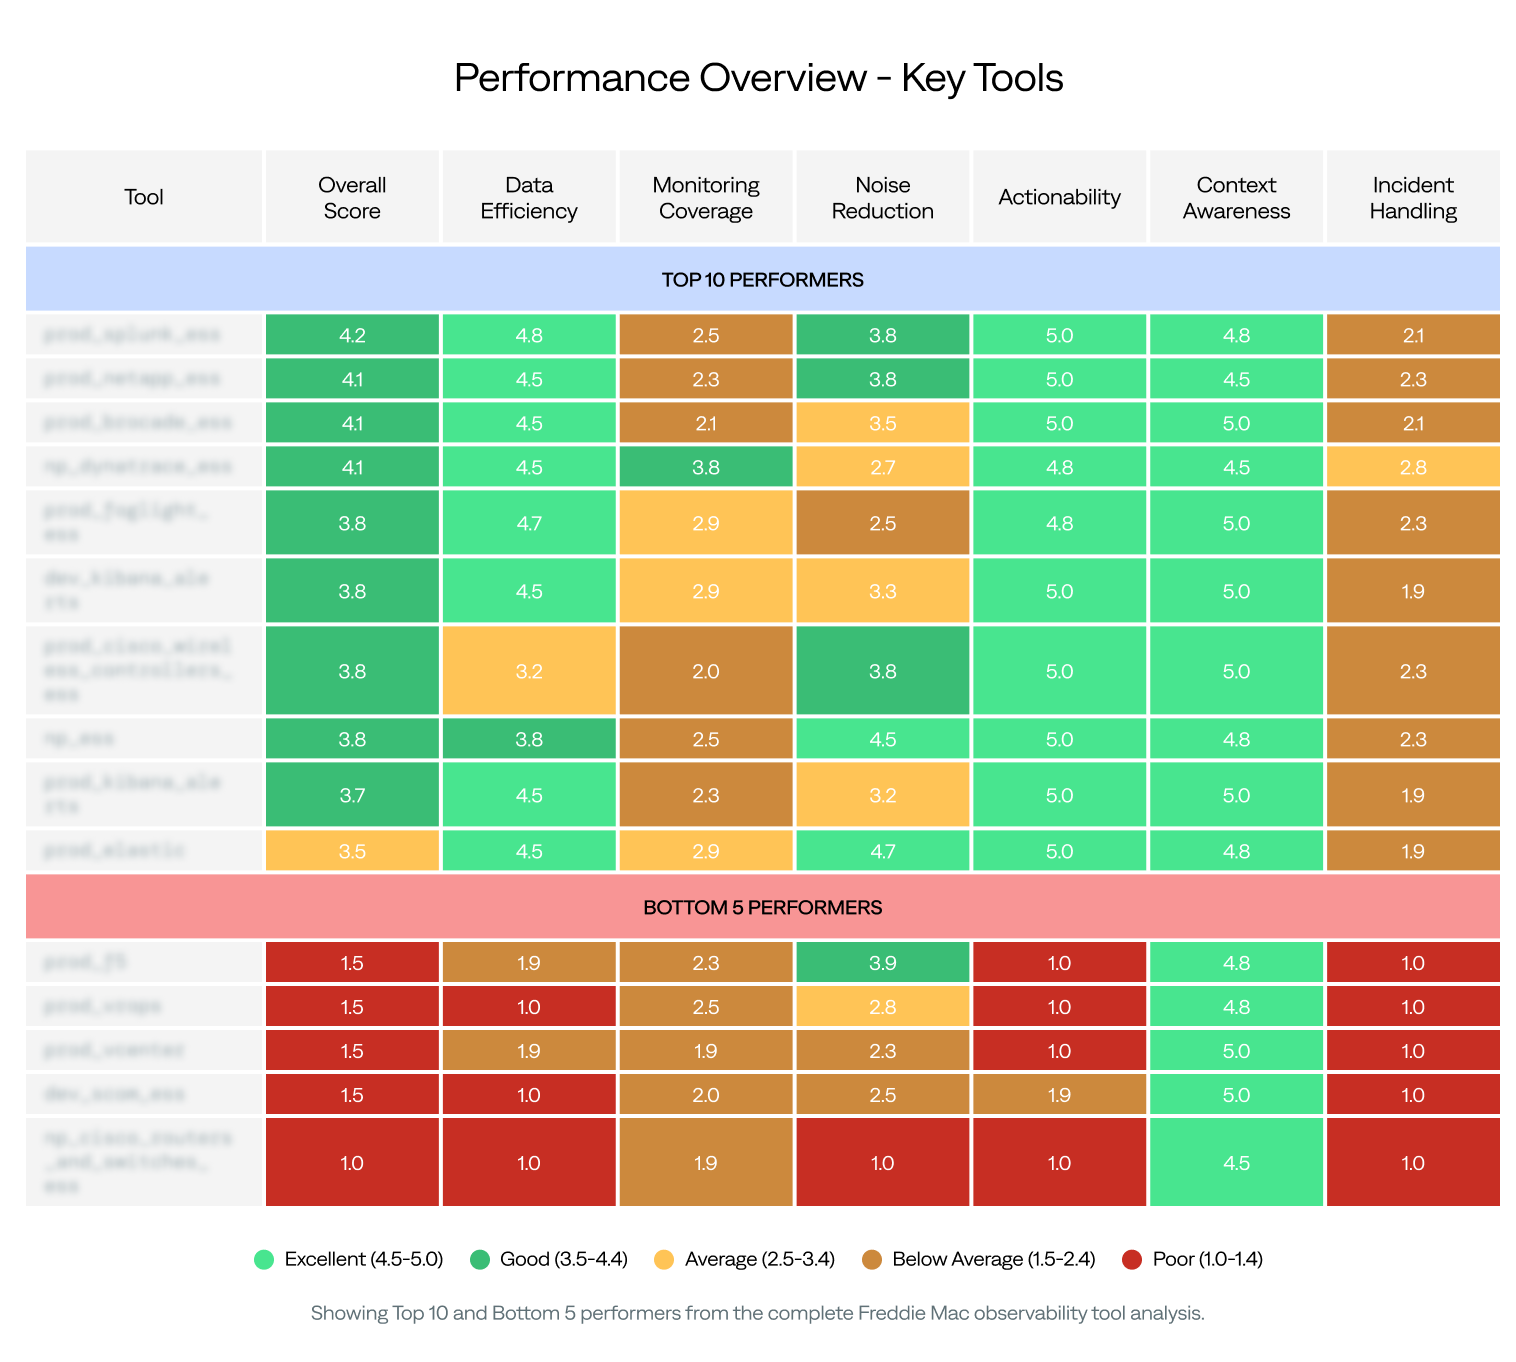
When enterprises run dozens of monitoring and observability tools, performance gaps almost always emerge. By applying our Observability Scorecard, our customers consistently see their tool portfolio fall into three groups:
- Top-tier tools that clearly add value and should be scaled.
- Middle-tier tools that show potential but require optimization.
- Bottom-tier tools that contribute little to no business value, making them prime candidates for rationalization.
In some cases, removing bottom-tier tools can reduce portfolio complexity by double digits while cutting operational noise by as much as 35-40%. This simplification reduces costs while creating a leaner, more reliable monitoring environment that strengthens service availability and operational efficiency.
IHG improves visibility, reduces costs, and improves the actionability of alerts with BigPanda
IHG used BigPanda to gain an overview of its observability stack. IHG owns, leases, and manages over 6,000 hotels worldwide, with 1,800 more properties in development. As IHG expanded, the Unified Command Center (UCC), IHG’s centralized monitoring and alerting organization, experienced an overwhelming influx of events from all their observability tools that made it difficult to identify actionable alerts from event noise, causing incidents and outages to occur.
IHG utilized BigPanda to gain a centralized overview of its observability environment. This enabled the UCC to filter out false positive alerts, identify and consolidate redundancies, and add context to events from underperforming observability tools to transform them into actionable alerts. Overall, IHG increased the availability of key applications while reducing costs and IT complexity.
Begin your tool rationalization journey with BigPanda
Observability sprawl won’t slow down on its own. The longer enterprises delay, the more entrenched redundant tools become—and the more costly they are to support. By adopting a comprehensive framework, IT leaders can reduce noise, strengthen collaboration between observability and ITOps, and ensure every dollar spent contributes to service availability and customer experience.
If your team is struggling to decide which tools to keep, optimize, or retire, you’re not alone. The key is to move beyond opinion and measure value with data. Want to see where your tools stand? Book a demo to explore how our Observability Scorecard can help your organization rationalize intelligently and align your observability practice to the most important ITOps outcomes.