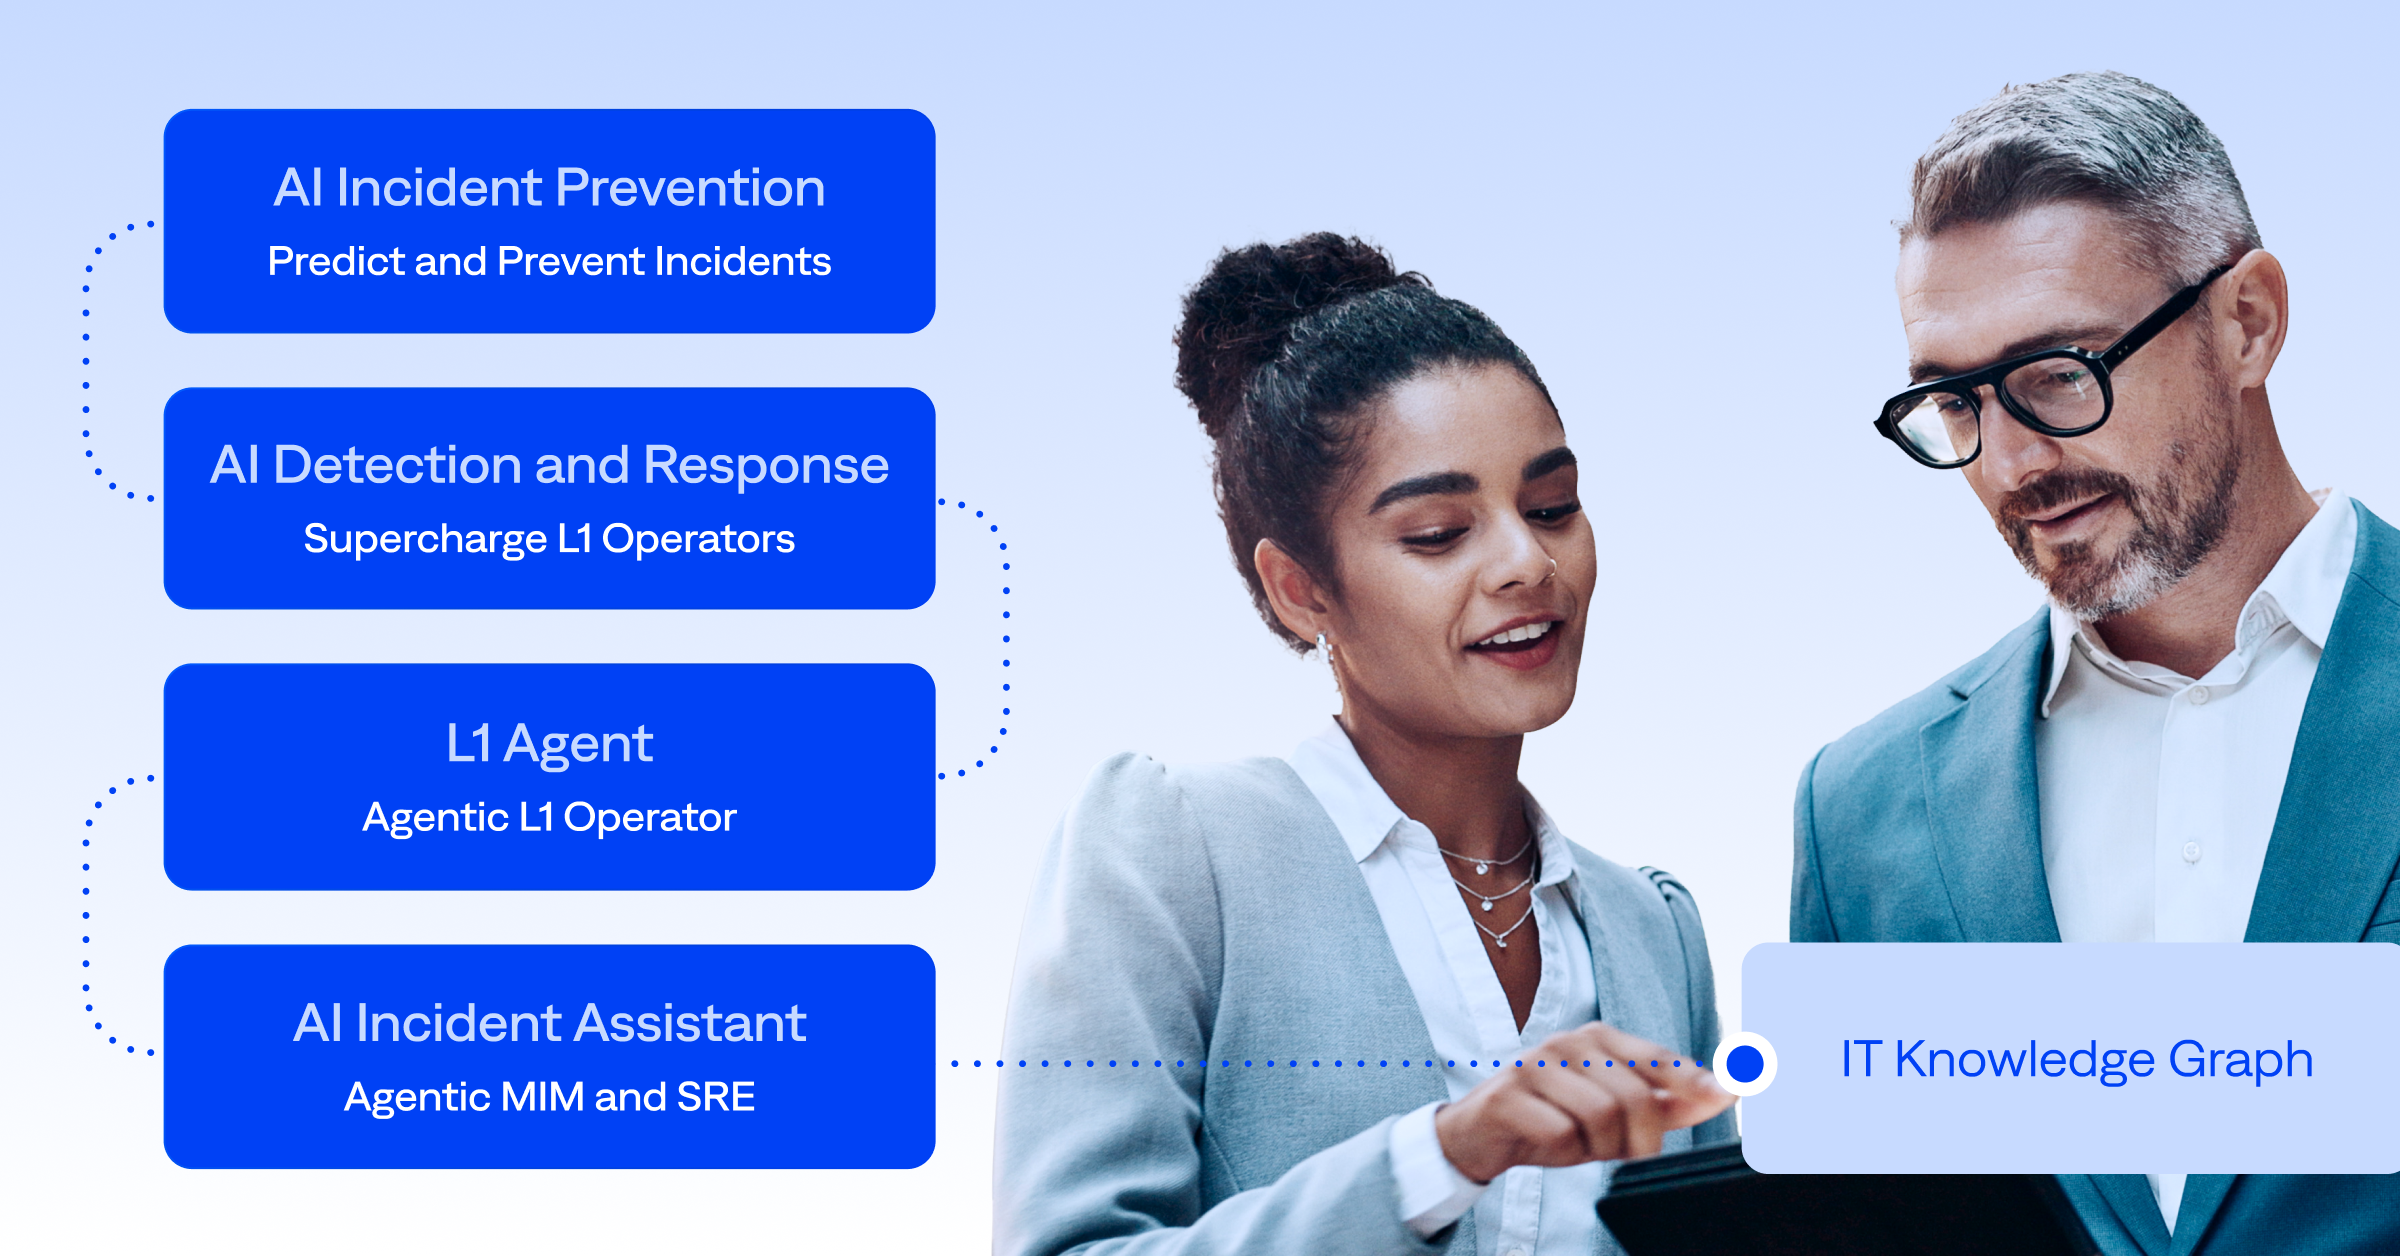
|

Overheard at Bamboo Lounge: Unified Analytics in action

4 min read
Time Indicator

Data: there’s a lot of it out there and making good use of it is difficult—especially in the context of IT Operations. Organizations need to know what information they’re after, sure. But they must also understand how to parse through data in a way that provides both executive visibility and proves value—all without overwhelming their IT Ops teams with manual efforts.

During BigPanda’s recent Bamboo Lounge community event, Unified Analytics in action, four customers from the financial and media industries joined the panel to discuss how they consume and visualize their IT operational data with analytics.

Before Unified Analytics, an enhancement of the current analytics offering from BigPanda, all four panelists agreed their systems lacked visibility into the data they generated. One customer in the media space shared, “Before BigPanda and Unified Analytics, we didn’t have insights into our data. We didn’t have good key performance indicators [KPIs] or metrics, so it was difficult to drive adoption or make efficiency recommendations for our processes when there wasn’t specific data that we could point to.”

This was not a unique story among the panel, or customer audience as a whole. Our panelist from the financial realm expressed a similar struggle. “We didn’t really have a process of analyzing data, and we quickly realized how important this need was going to be for us. We tried to manually log and analyze data, but, given the volume, it was impossible to keep up that manual process.”

The message was clear. There was plenty of raw information coming in, but the sheer volume made the already daunting task of translating data into strategic initiatives next to impossible. Furthermore, it created a visibility gap between IT Ops teams and executive management.

For all panelists, the transition to Unified Analytics allowed them to capture and interpret their data in a new way, allowing them to target new or improved value KPIs and influence efficient change for day-to-day operations, as well as high-level strategy for the organization.

One customer noted, “Specifically, the self-service piece is really powerful for us. It gives us a better understanding of the data we were actually sending and the various widgets we were setting up. With that transparency, we could actually set up more meaningful widgets. That is a big advantage to the new Unified Analytics platform.”

With the new analytics, you are given a more flexible experience to create dashboards based on the specific insights your leadership needs clarity on. You also have the capability to accurately create high-level visibility into those exact metrics and KPIs. It gives you the ability to create a message to take up to the C-executive level and drive those leadership discussions.

As one panelist shared, “We had a general idea of the amount of toil and pain that the alerts were generating, and how it was slowing down or disrupting our team, but nothing we could definitively report on. Now we can have metrics-based conversations with our teams and executive leadership. This is a conversation we could not have before.”

Of course, executives aren’t the only ones who benefit from smart collection and dissemination of critical company data. For all customers on the panel, the ability to actively create more practical efficiencies at every organizational level—based on insights drawn from useful visual representation on the dashboard—is another recursive benefit.

BigPanda’s Unified Analytics will be moving to the open beta phase soon. For an opportunity to participate, don’t hesitate to reach out to your customer success manager (CSM) or account executive (AE) today. Your CSM or AE can also connect you with the Value and Adoption team if you’re interested in continuing the IT Ops data and reporting discussion. Wherever you might be in your IT Ops journey, we’re here to help.